Final Project
Background Study
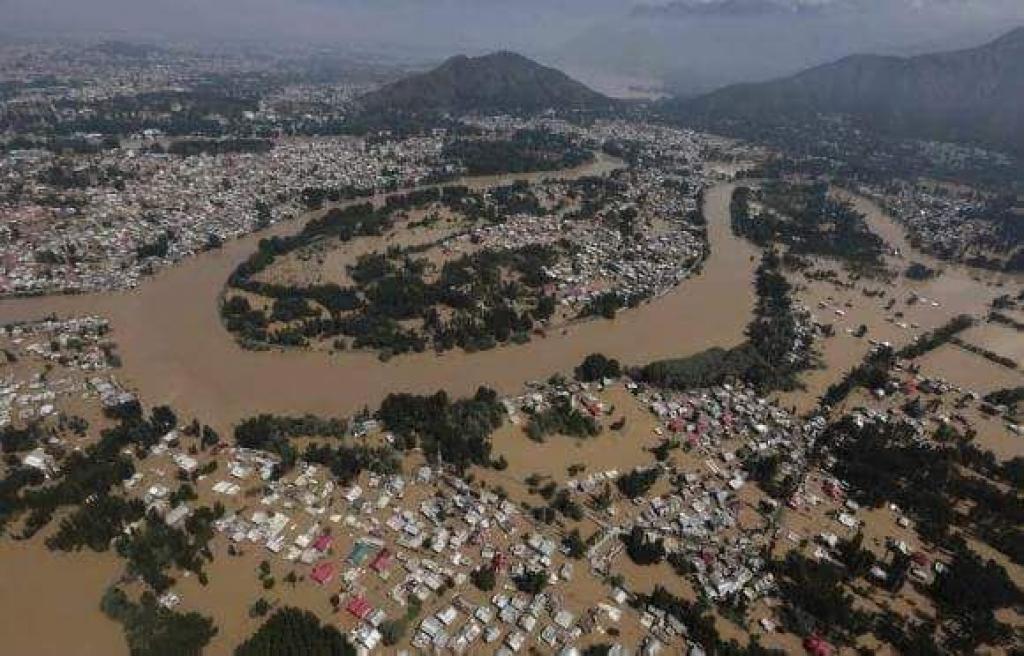
I hail from state of Kerala, India which is known as "Gods own Country". The state is known for its tropical climate with a backwaters, beautiful beaches, buildings with historic importance etc. Everything was going fine till 2018. On 16 August 2018, severe floods affected the south Indian state Kerala, due to unusually high rainfall during the monsoon season. It was the worst flood in Kerala in nearly a century. Over 483 people died, and 140 are missing. According to the Kerala government, one-sixth of the total population of Kerala had been directly affected by the floods and related incidents. The main reason behind the flood was the heavy downpour where, Kerala received heavy monsoon rainfall, which was about 116% more than the usual rain fall in Kerala, on the mid-evening of 8 August, resulting in dams filling to their maximum capacities. Almost all dams had been opened since the water level had risen close to overflow level due to heavy rainfall, flooding local low-lying areas. Research from Purdue, IIT researchers reconfirmed the fact that the rainfall was the reason for this disaster, not the mismanagament of dams. Even though rescue activites were taking place in full fledge, Over 483 people died, and 140 are missing, while The Economic Times reported that 33,000 people were rescued.
One of the reasons for the death was improper weather alert system before the flood. In state of Kerala, people normally don't check the weather as they find it inaccurate based on the trends but this is not the case in foreign countries, were weather forcast is given atmost importance and accuracy.
So my idea is to create a table top weather map for the state of Kerala, where it depict the rainfall warnings through visual indications. In laymman terms, each district will have a LED alert system where it continuosly change it's color depending upon the data from disaster management authorities. If a district say Kochi, is predicted to receive heavy rainfall within 24 hours, the district of Kochi in the weather map will turn from green to red color. This device will always be connected to the internet and the user can easily check whether they are in risk or not just by looking. You can ask whether this alert can easily be implemented in mobile phones but, I feel this device would automatically grab your eye's attention and would be more useful in evacuation in case of heavy rainfall prediction.
My concept is different from what is shown above, here I am concentrating to the state of Kerala alone, where the device shows heavy rainfall alerts alone which provide a much more accurate experience to the user. Furthermore, the number of cyclone alerts for the state of Kerala is increasing over the past 1 year like Cyclone Tauktae from Arabian sea and Cyclone Yaas from Bay of Bengal. In 2017 Cyclonic Storm Ockhi had killed 143 fishermen in Kerala, uprooted hundreds of trees, snapped power and communication lines, toppled hoardings, destroyed houses and damaged crops across the southern districts. The fatalities could have further reduced with the help of simple alert system which my project is focused on. The below tool gives an insight about the live wind flow across the southern part of India. Credits: Windy
METARmaps
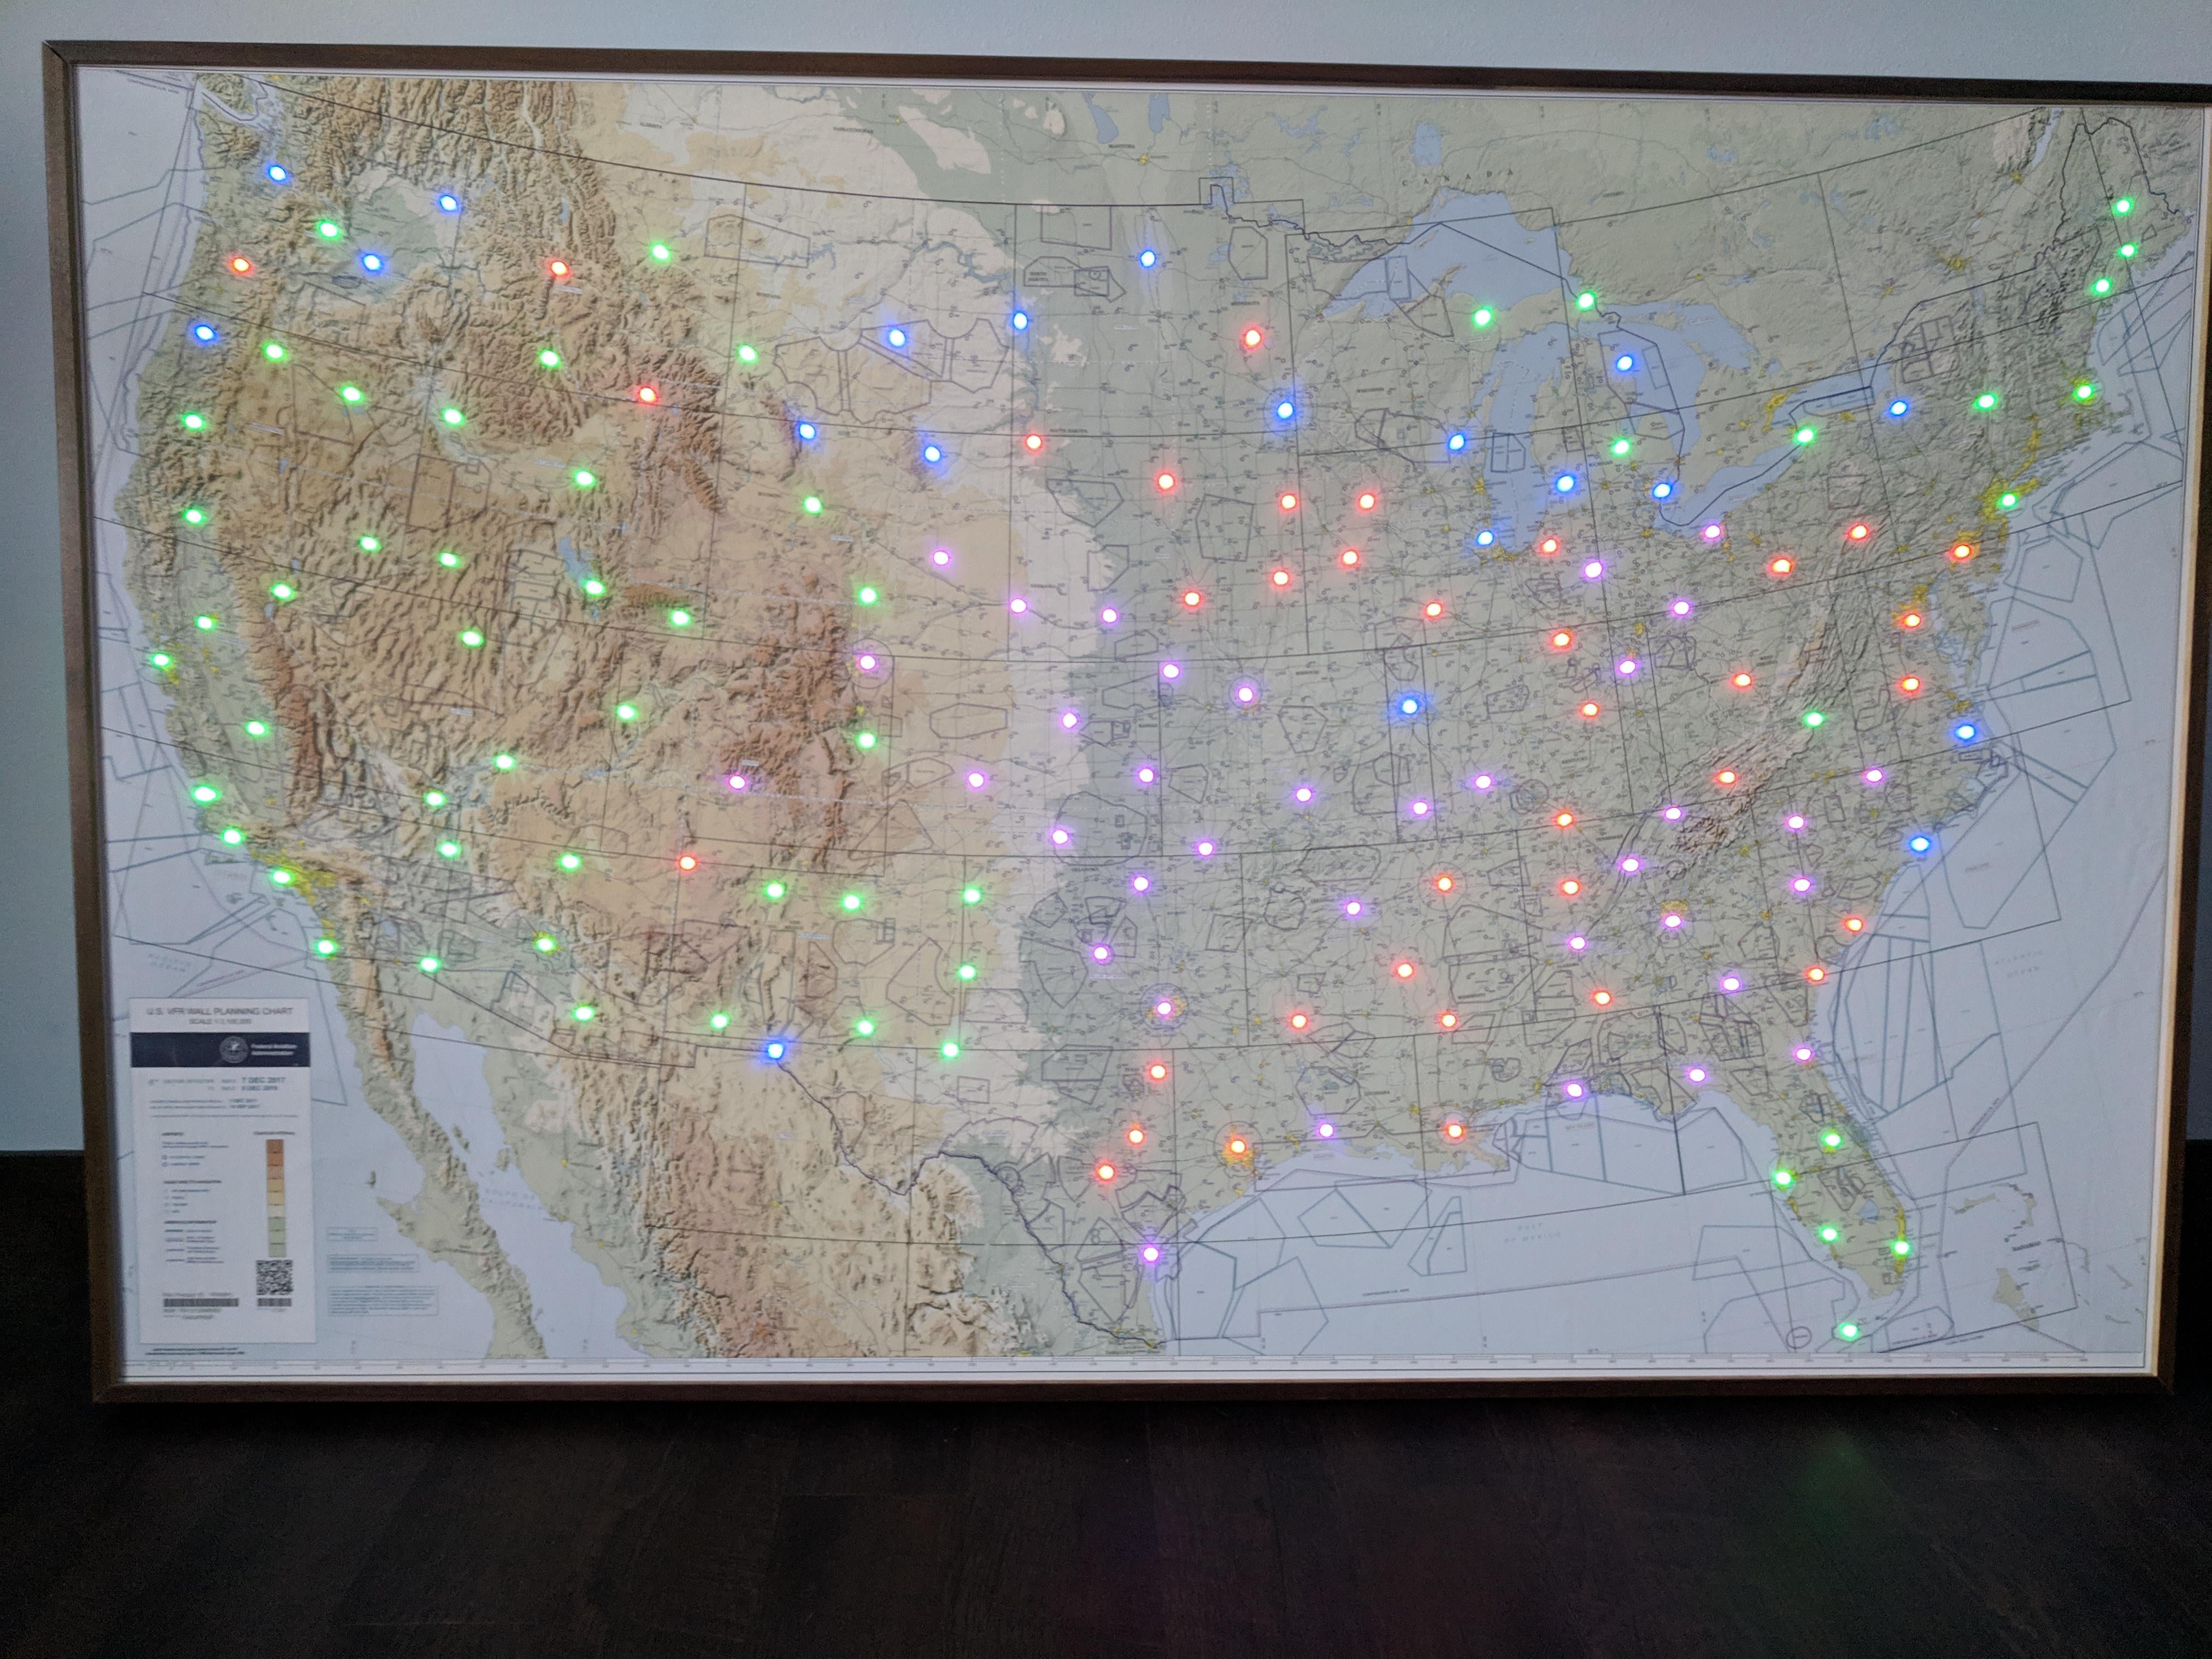
This product is not directly related to my idea but the working is similar to that of mine. Meticulously hand-crafted METARmaps™ are functional aviation art which blend advanced computer and print technologies to create living art worthy of a spot on your wall. The METARmaps are available for various states of US, like Illinois, California etc. but they are quite expensive. METARmaps design starts with a portion of beautifully published charts, adds a tiny computer, Wi-Fi and individually addressable LEDs to acquire and display weather data in real-time.
The latest version of this product, functionality includes: selectable Update Sweep, Wind, Gust and Lightning animations, Timed Dimming/Off control and Network connection - all controlled by using your mobile phone. But, I feel this product lack aesthetic appeal since I am planning to make a custom laser cutted and sandblasted map for the state of Kerala, which will definitely look better than a conventional cloth/paper map. For more details about METARmaps click here.
DIY Projects
There are several DIY weather maps which looks similar to the METARmaps. But they all use conventional maps which I think is not cool at all. These DIY projects are mainly for Aviation uses rather than for emergency uses. I will link some of the DIY projects below:
| |
|
|
|
|
|---|---|---|---|---|
| 1 | 3mm Birch Plywood | 100*100 cm | Fab Inventory | Rs.500 |
| 2 | Neopixel LED | 14 Nos. | Robu.in | Rs.700 |
| 3 | Vinly Sheet | 10cm*20cm | Fab Inventory | Rs. 100 |
| 4 | 3D Printing PLA Filament | 200g | Fab Inventory | Rs. 550 |
| 5 | 3mm Acrylic Sheet | 10cm*10cm | Fab Inventory | Rs. 100 |
| 6 | Jumper Wires | 6 | Fab Inventory | Rs. 50 |
| 7 | Copper Sheet | 10cm*10cm | Fab Inventory | Rs. 100 |
| 8 | ESP32 | 1 | Fab Inventory | Rs. 500 |
| 9 | Resistors | 2 | Fab Inventory | Rs. 10 |
| 10 | Capacitors | 1 | Fab Inventory | Rs. 10 |
| 11 | SMD Buttons | 2 | Fab Inventory | Rs. 10 |
| 13 | Voltage Regulator 3.3V | 1 | Fablab Inventory | Rs. 20 |
| 14 | SMD LED | 2 | Fablab Inventory | Rs. 20 |
| 15 | DC Connection jack | 1 | Fablab Inventory | Rs. 10 |
| 16 | Fevi Bond Glue | 1 packet | Fablab Inventory | Rs. 40 |
| 17 | 3mm Foam Board | 10cm*20cm | Fablab Inventory | Rs. 50 |
| 18 | FTDI Cable | 1 | Fablab Inventory | Rs. 100 |
| 19 | IR Proximity Sensor | 1 | Fablab Inventory | Rs. 150 |
| 13 | Miscellaneous | 5 | Fablab Inventory | Rs. 100 |
Majority of the parts for this project requires fabrication. The entire map must be CNC Milled using Wood and Foam Board. The individual neopixel LEDs must be individually wired. The base must be 3D printe using PLA and closed using a laser cutted acrylic sheet. The PCB must also be custom designed, milled and soldered.
| |
|
|---|---|
| Laser Cutting | To make the base closure |
| 3D Printing | To make the base of the map |
| PCB Designing & Milling | To fabricate the main control board |
| CNC Milling | To fabricate the map |
| Vinyl Cutting | To create a sticker for the rear side of the map |
| Soldering & Wiring | To individually connect the LEDs and to solder the components onto the board |
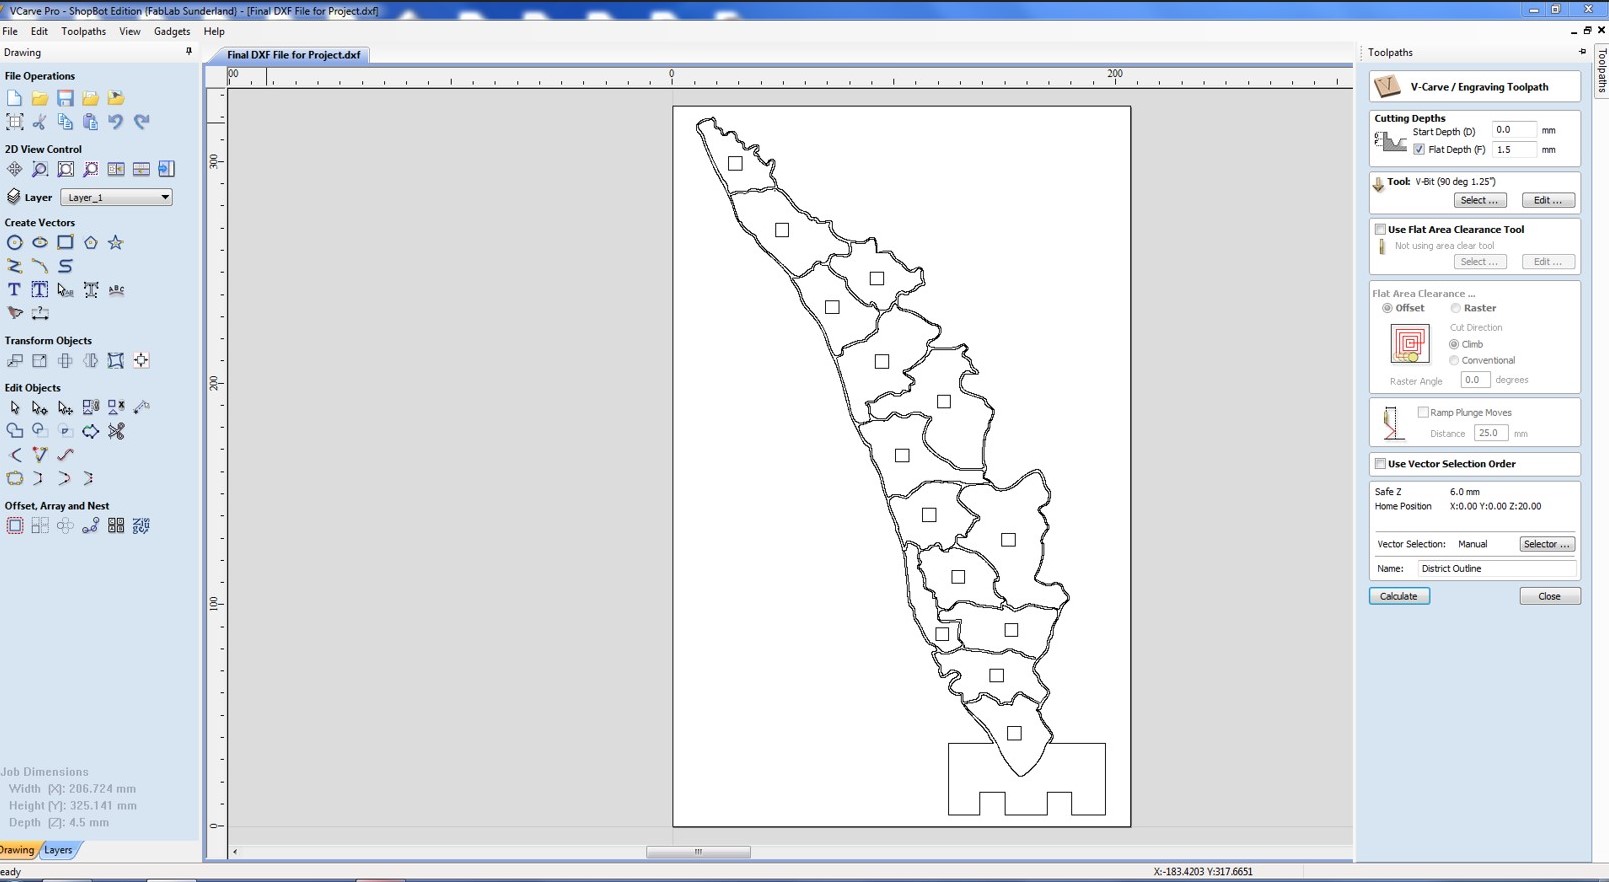
- How will you design the custom map? I will first take the vector image for the state of Kerala, make necessary corrections and send it to the VCarve Pro software.
- How does the data get updated? The data will be manually updated by the user from Git and it will be pulled by the ESP32 to update the map
- What is the input here? Is it the data or is there any other sensor? The data itself is the input here, but inorder to meet the requirements, I will be adding a IR Proximity Sensor.
- Can you complete this project within time? I have the willpower to complete this before the deadline!
The project although seems simple, solves a big problem and would definitely be useful for the residents of the state. From my learnings building this small project, I plan to expand this to bigger maps with additional data representation. If possible, I would develop this is as market ready product for the residents of my state.
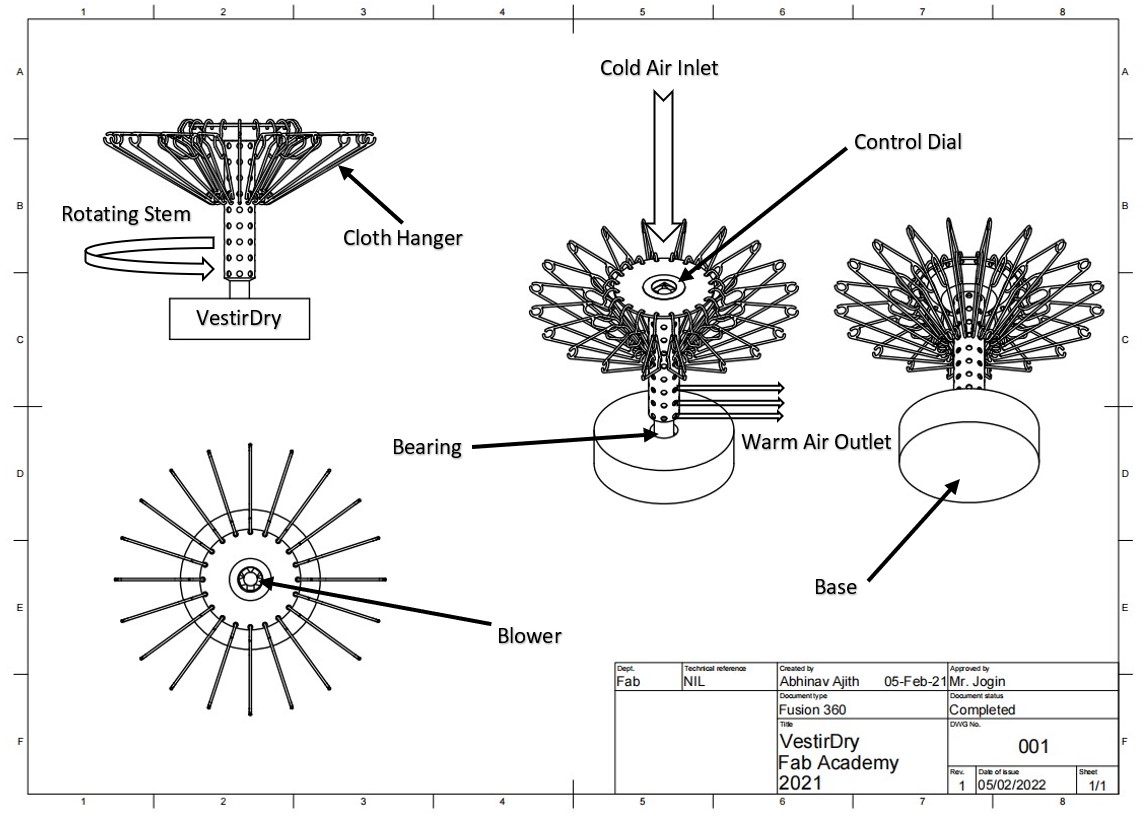
My initial idea for the final project was to design a portable cloth dryer for my apartment. The idea about this cloth dryer came into my mind in response to a hardship that I am facing now. I used to be a day scholar for almost 21 years and since I am enrolled in Fab Academy, I had to live in a motel. The real problem arised when I tried to wash and dry my cloths. The cloths took a long time to get dried and the available conventional dryers are not at all cheap and portable. Since this is a problem that I am presently facing, I thought of making an energy efficient yet portable dryer for my personal use.The idea about this cloth dryer came into my mind in response to a hardship that I am facing now. I used to be a day scholar for almost 21 years and since I am enrolled in Fab Academy, I had to live in a motel. The real problem arised when I tried to wash and dry my cloths. The cloths took a long time to get dried and the available conventional dryers are not at all cheap and portable. Since this is a problem that I am presently facing, I thought of making an energy efficient yet portable dryer for my personal use.
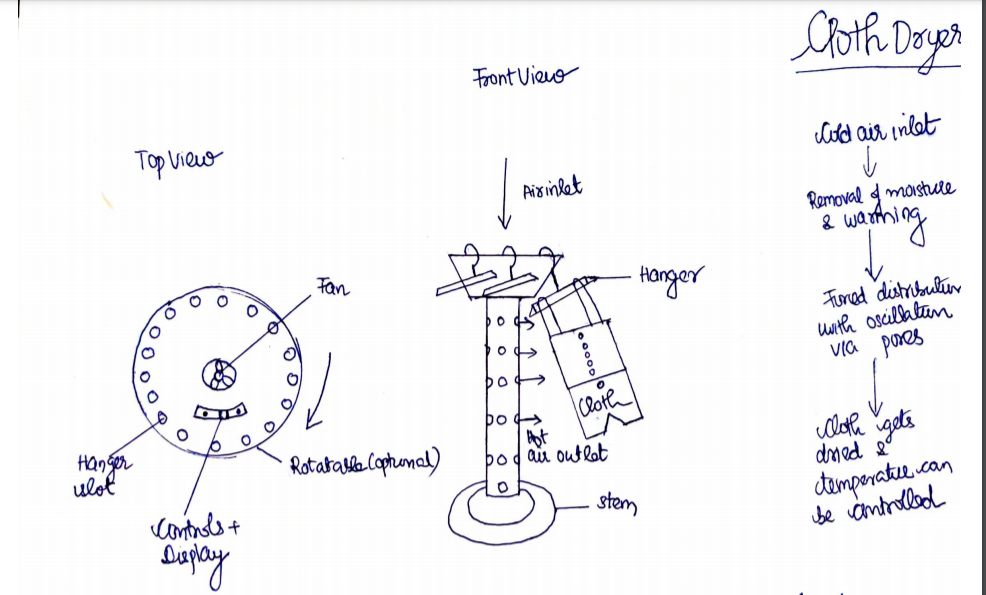
The technology behind the project is quite simple & it will definitely utilize all the tools available in a Fab Lab. The product comprises of mainly 3 parts: head, stem & a stand. The air will be sucked in from the top using a blower, where the humid air will be dehumidified using materials/hot air. If hot air is used a nichrome wire based heater (similar to a hair dryer) is attached along with the blower thereby dehumifiying the air. The hot air is then passed through various pores (which maybe provided with osciallation for uniform distribution) and is fed to the cloths that need to be dried. The whole system will only be similar to the size of a coffee table and can be used in small rooms. The temperature of the dryer can be set manually or remotely via a mobile device. The dryer will automatically turn off once the required temperature has been reached thereby preventing the risk of cloth damage.
Even though I deseperately needed this project, the lockdown in my state forced me to change the project. I am no longer staying in my apartment, and after a lot of introspection, I feel that it's time to change the project to a better or cooler one which can be completed in given time. In addition, getting materials for the stem (middle part) and for the given dimensions was difficult which all forced me to change the project to complete this academy.
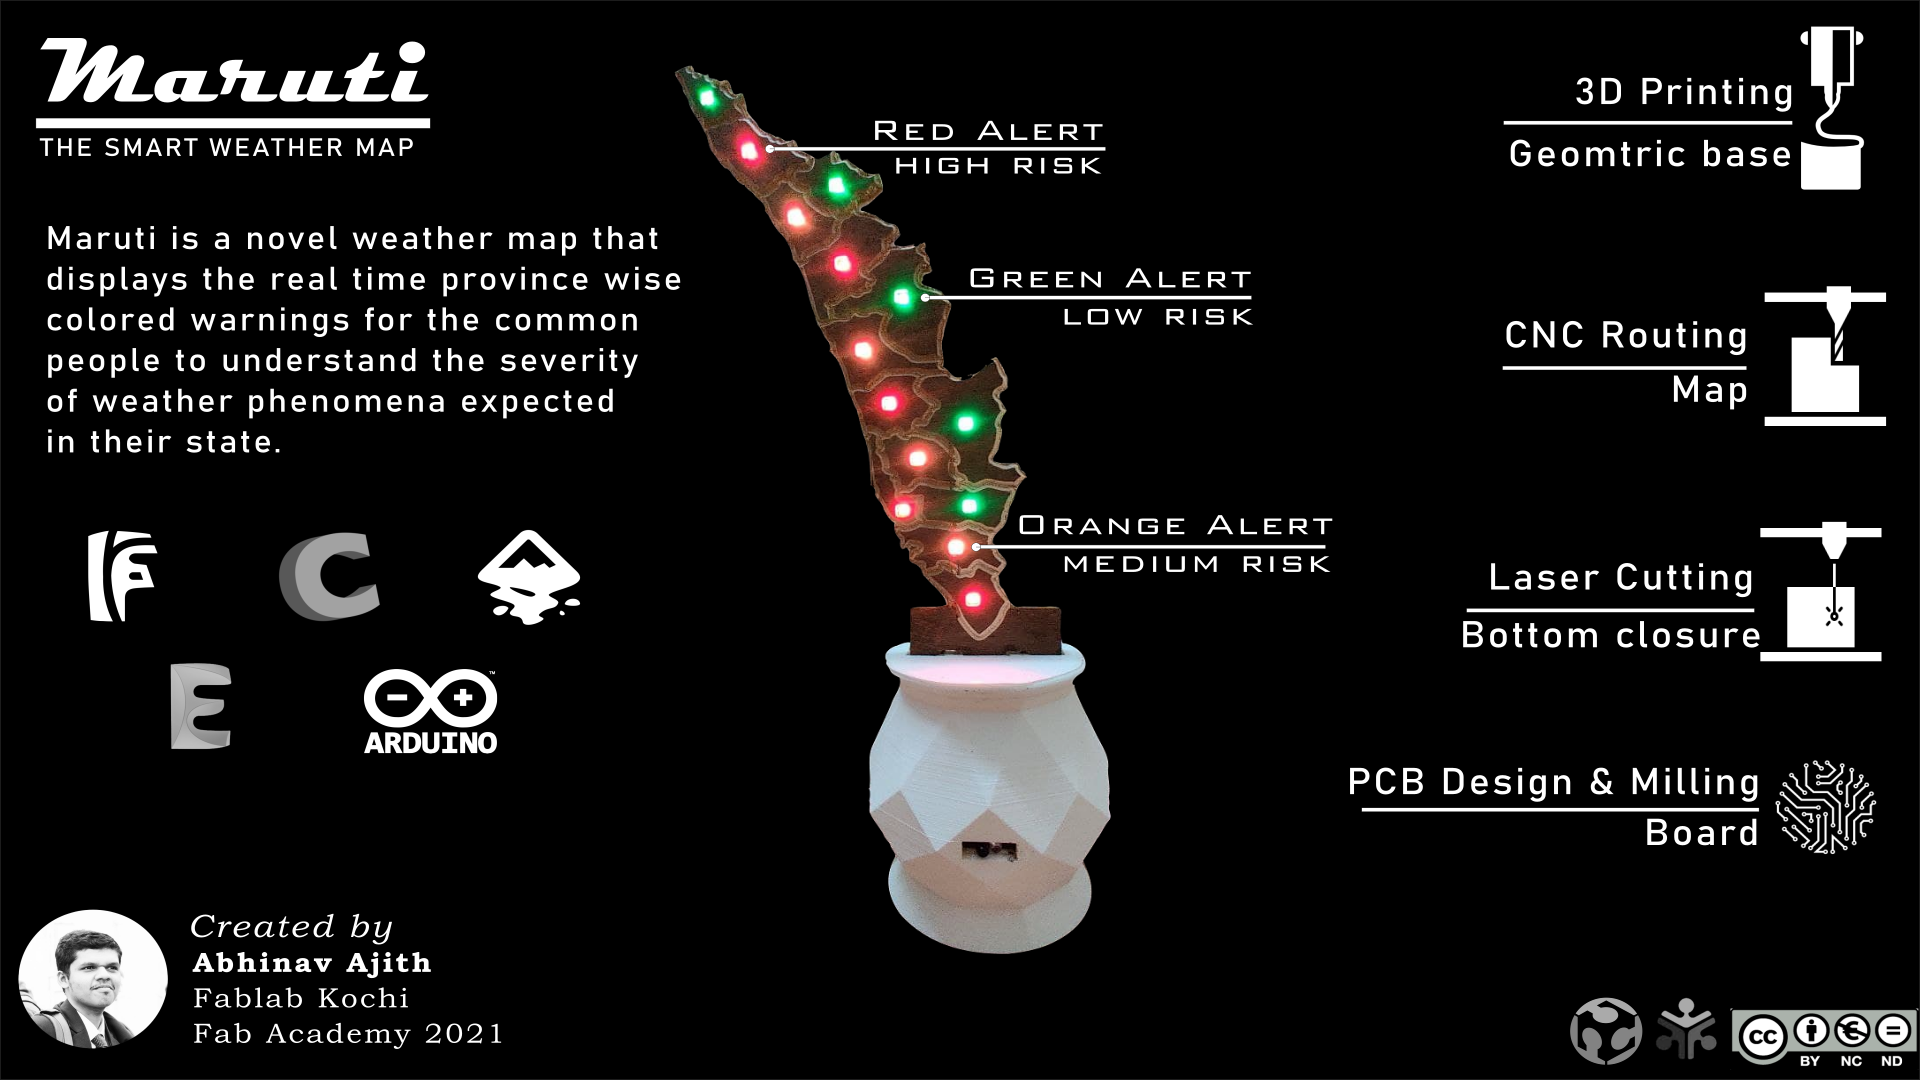
The final project idea is to create a table top weather map for the state of Kerala, where it depict the rainfall warnings through the visual indications. In layman terms, each district will have a LED alert system where it continuosly change it's color depending upon the data from disaster management authorities. This device will always be connected to the internet and the user can easily check whether they are in risk or not just by looking. You might be thinking, why I had named the project as "Maruti". Maruti is a Sanskrit word referring to Hanuman, son of Vayudeva, the Hindu Wind God Vayu. Since the weather is mainly controlled by the action of winds, I beleive this name is a perfect fit for the project.
The main reason behind the idea for the project is Kerala Flood that happened in 2018, that had created a lot of casualities due to lack of prior weather alert system. So my idea is to create a table top weather map for the state of Kerala, where it depict the rainfall warnings through visual indications. In laymman terms, each district will have a LED alert system where it continuosly change it's color depending upon the data from Github repository updated by the disaster management authorities. If a district say Kochi, is predicted to receive heavy rainfall within 24 hours, the district of Kochi in the weather map will change the color depending upon the severity of the weather.This device will always be connected to the internet and the user can easily check whether they are in risk or not just by looking at the real time map. You can ask whether this alert can easily be implemented in mobile phones but, I feel this device would automatically grab your eye's attention and would be most suited for common citizen who don't have proper knowledge in smartphone applications.
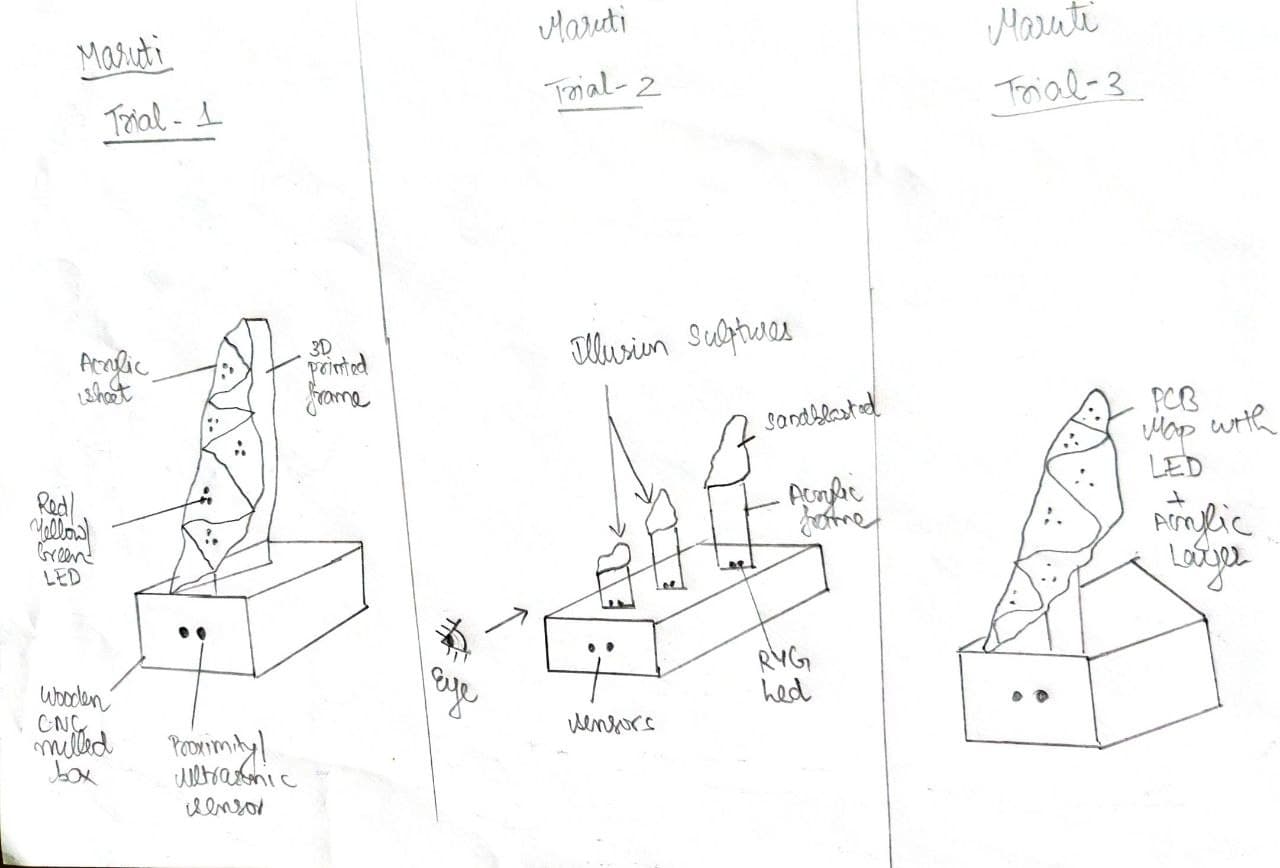
Based on the above figure, there are actually 3 different methods that I had found to approach this project. I will explain each of them below:
- Trail 1: Acrylic map with 3D printed housing
- Trial 2: Illusion Sculptures
- Trial 3: Custom desinged PCB Map
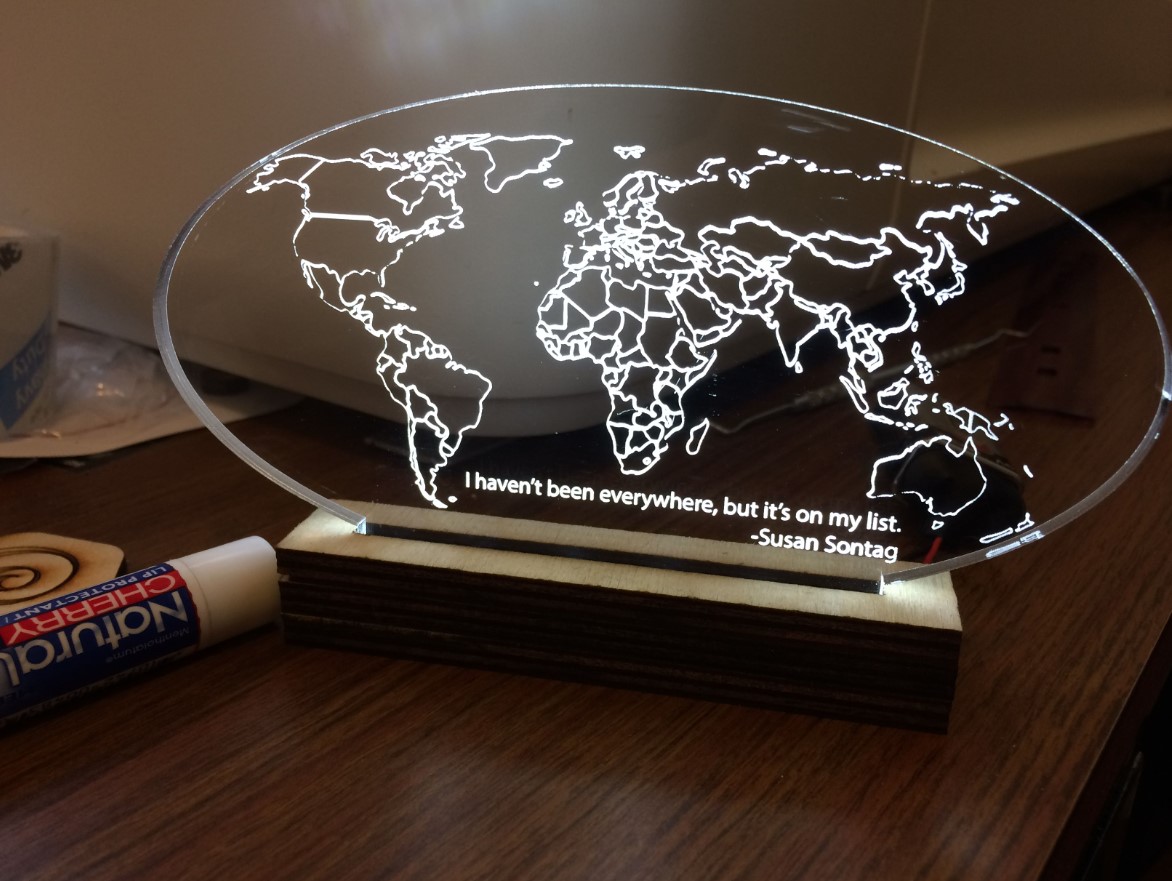
For this path, the base of the device remains the same while the portion with the map changes. I will be making the map using laser cutting process and the different districts will be seperated either using engraving process or by sandblasting. For this trail, a 3D printed case similar to the shape of acrylic sheet will enclose the LEDs while the acrylic map fits over them. The main disadvantage of this method, is that the beauty with transparent maps are lost and the light distribution may not be uniform. There is also another possibility that I will use acrylic frame to hold the LEDs.
This path will be quite interesting if I can make this within the deadline. Here I will be making each district as seperate entities with individual LED lighting from the bottom. The cool thing about this design is that the map will only be visible if it's view from right spot (ie front). This technology is commonly used for art showcases but I found it quite interesting. Instead of hanging the map, I will support it from the bottom as individual districts. The below mentioned video gives an example about this cool technique
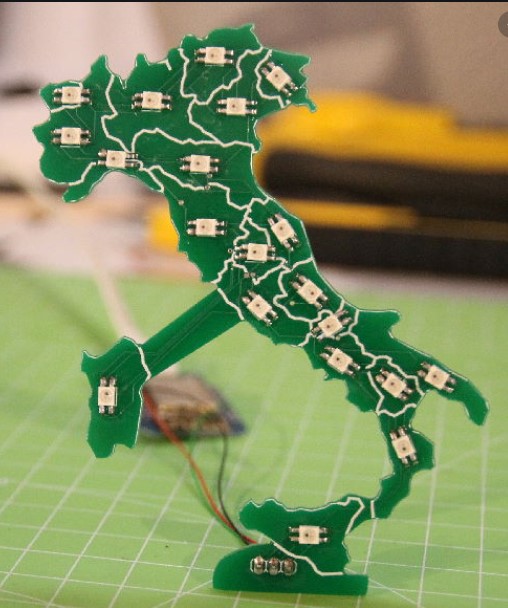
In this way, there will a custom milled PCB with LEDs in it without any extra wires connecting them to the microcontroller. The PCB will have the shape of the map and an acrylic sheet will be placed above it for aestheic purposes. Fortunately, I recently found a project called Dynamic Covid Tracking Map and this method I think will be much easier to make within the timespan.
Designing
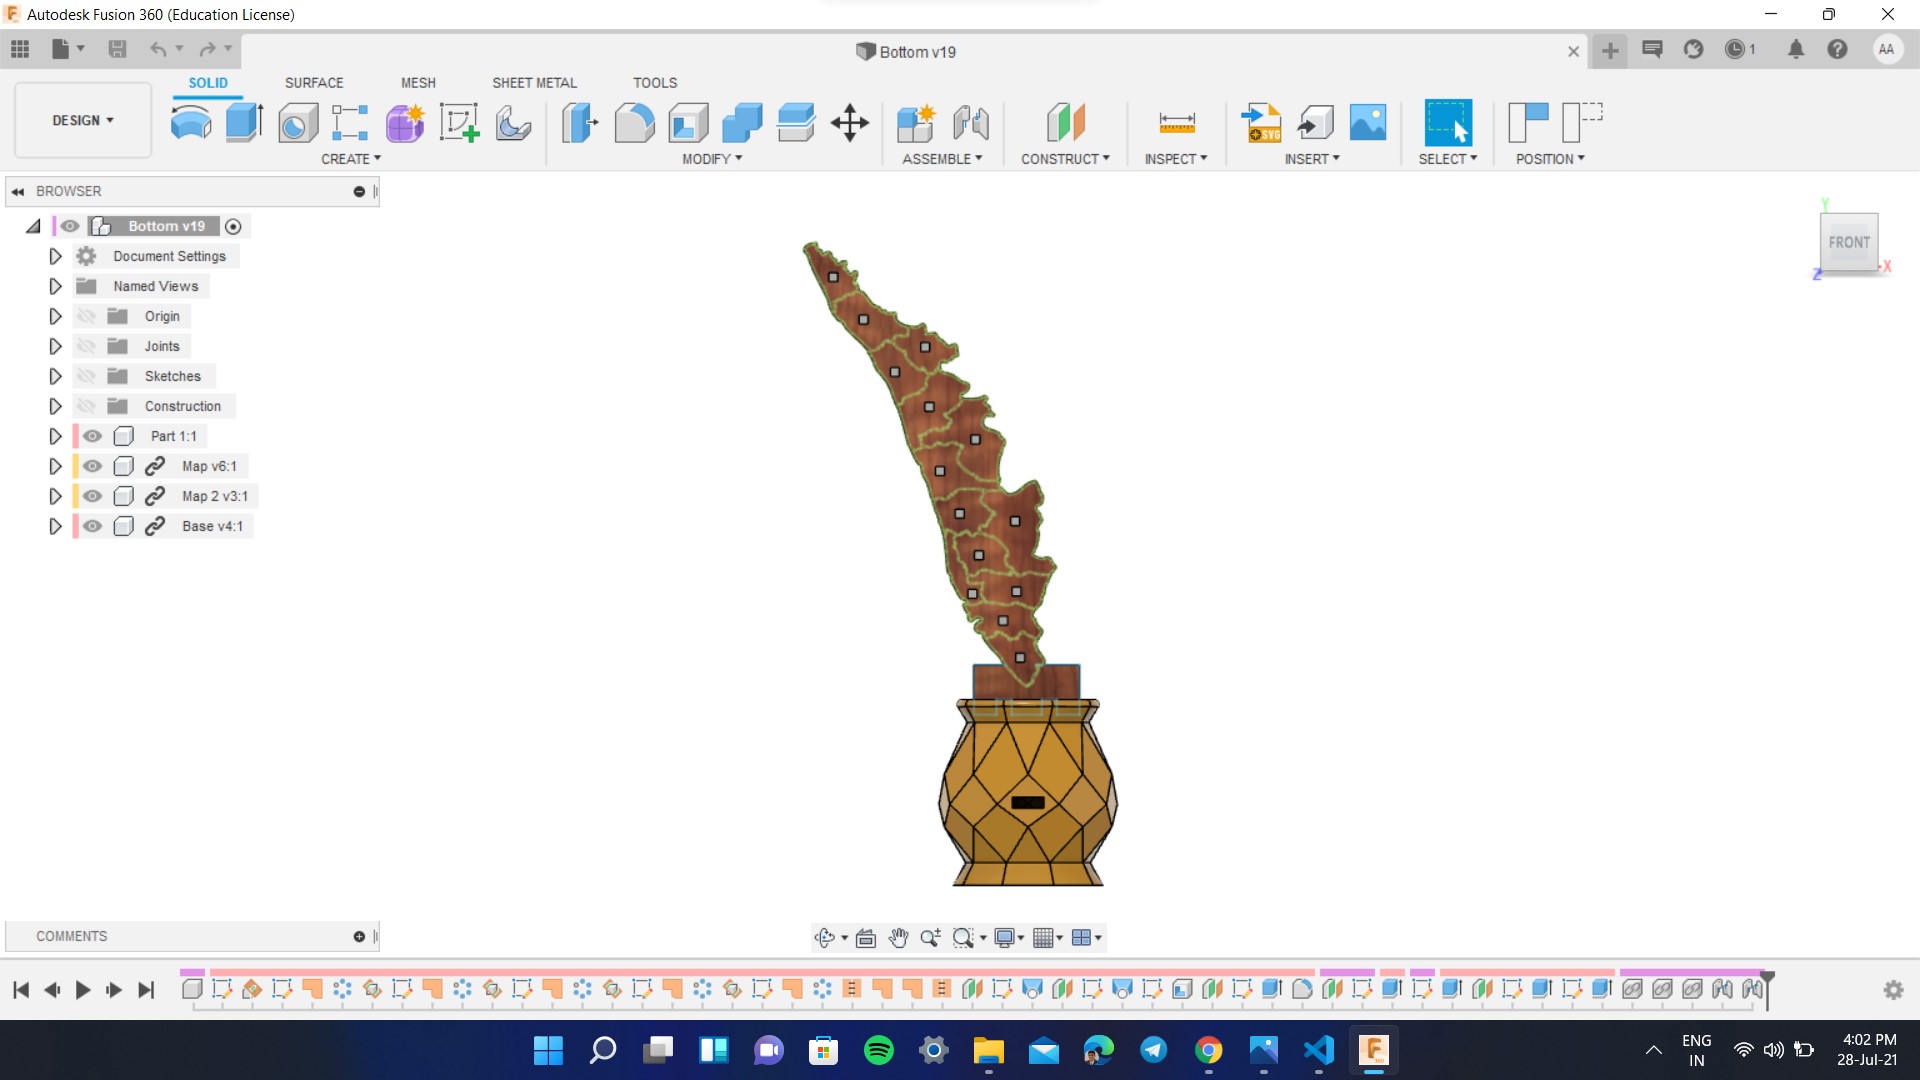
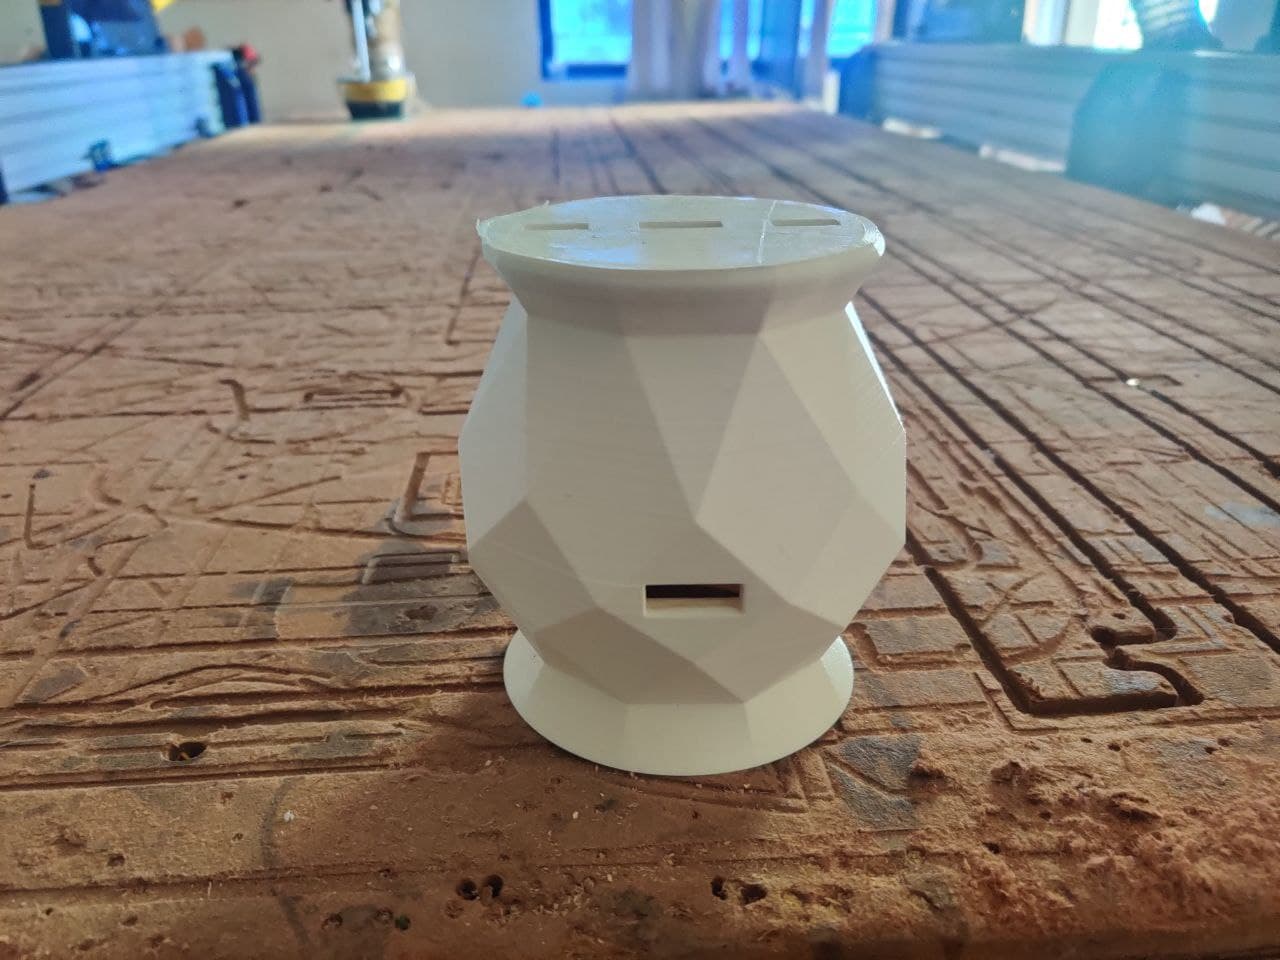
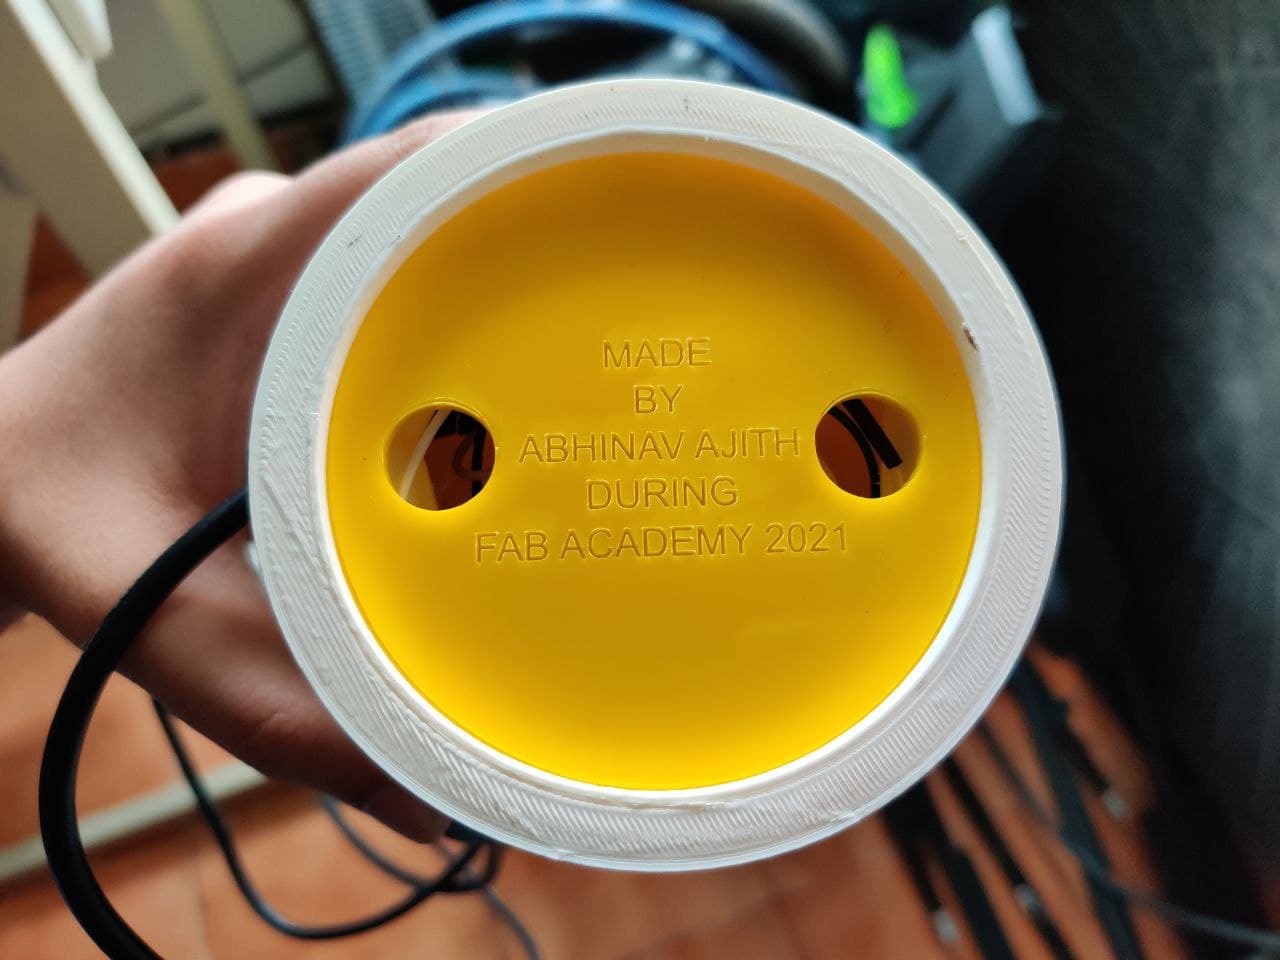
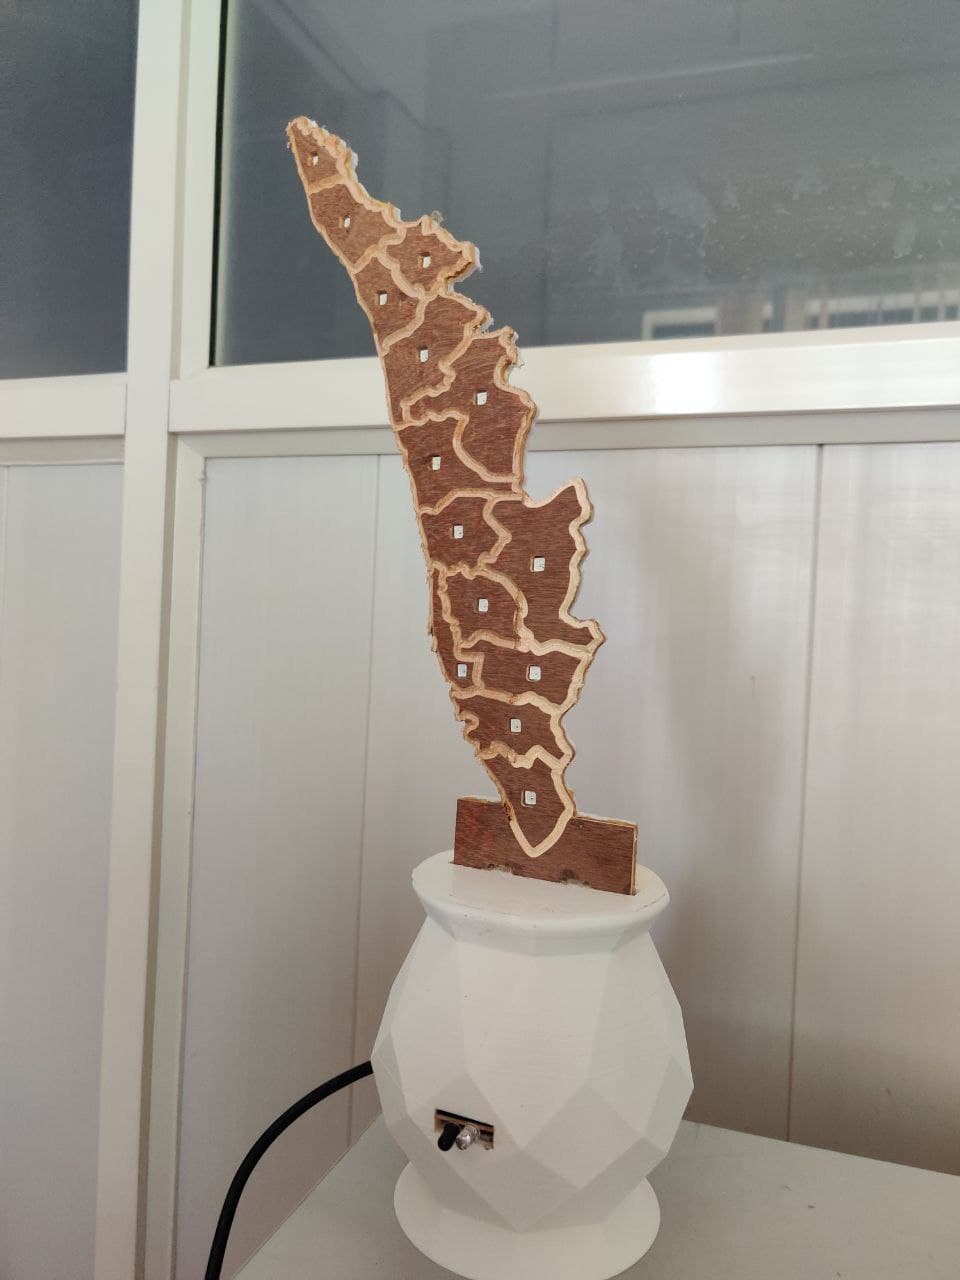
I had designed the full project using Autodesk Fusion 360. I had specifically made a geometric base so that it cannot be manufactured using any other method which further increases the novelty of the project. The whole design was done using parametric concept so that shape and size of the base can be changed by just changing the values. The base is also designed in such a way that the diameter of the bottom face is higher that the top so that weight is concentrated on the bottom, thereby preventing the tumbling risk. Provisions were provided for IR sensor module, power jack as well as FTDI cable so that the I don't have to remove the base closure everytime to troubleshoot the board. I had used patch commands and stich commands to create the geometric shape apart from basic operations. The below image shows the designing process and after designing I had exported the file as STL for 3D Printing.
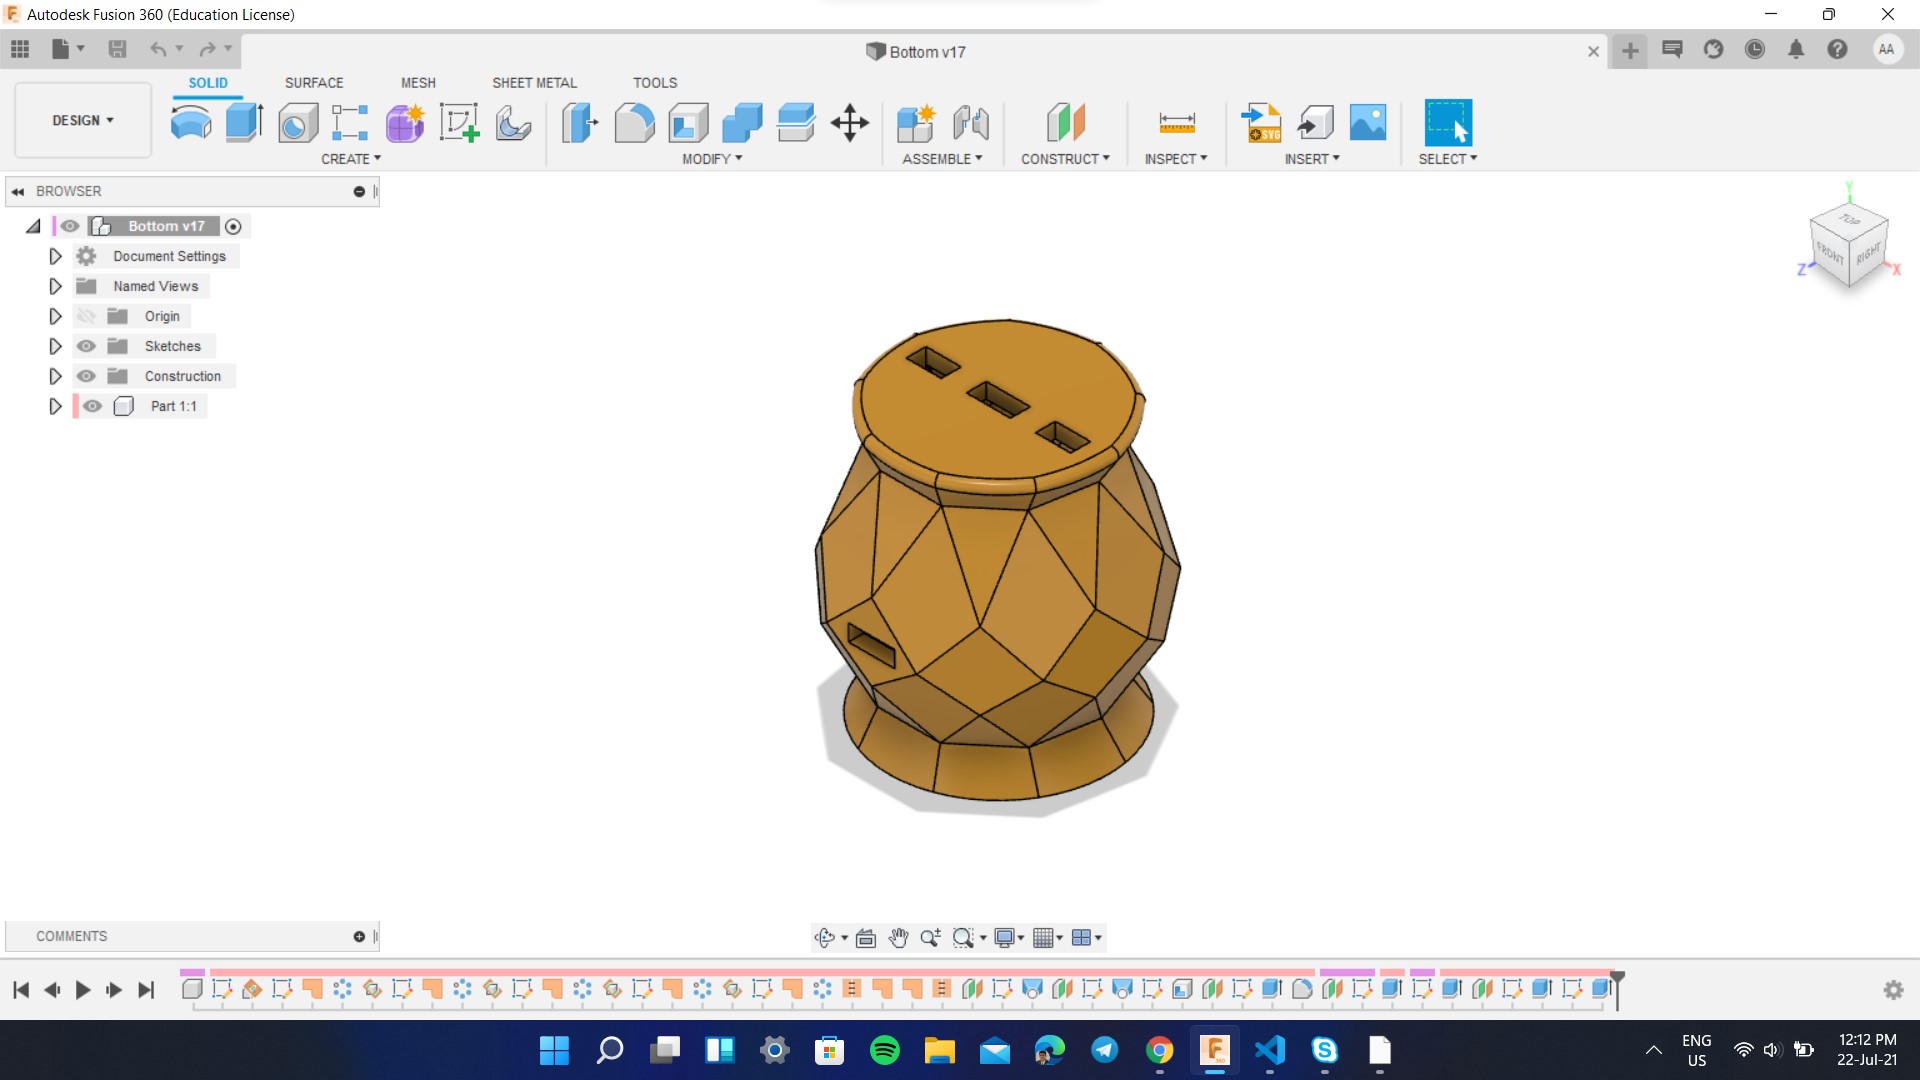
The below image shows the whole 3D model and I will attach the design file to the bottom of this page.
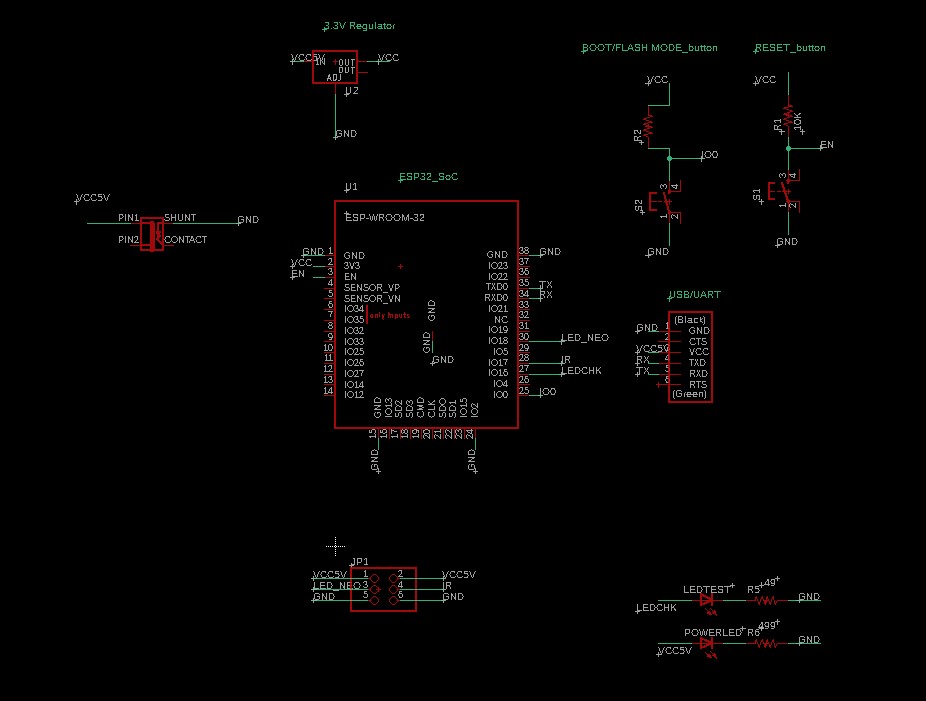
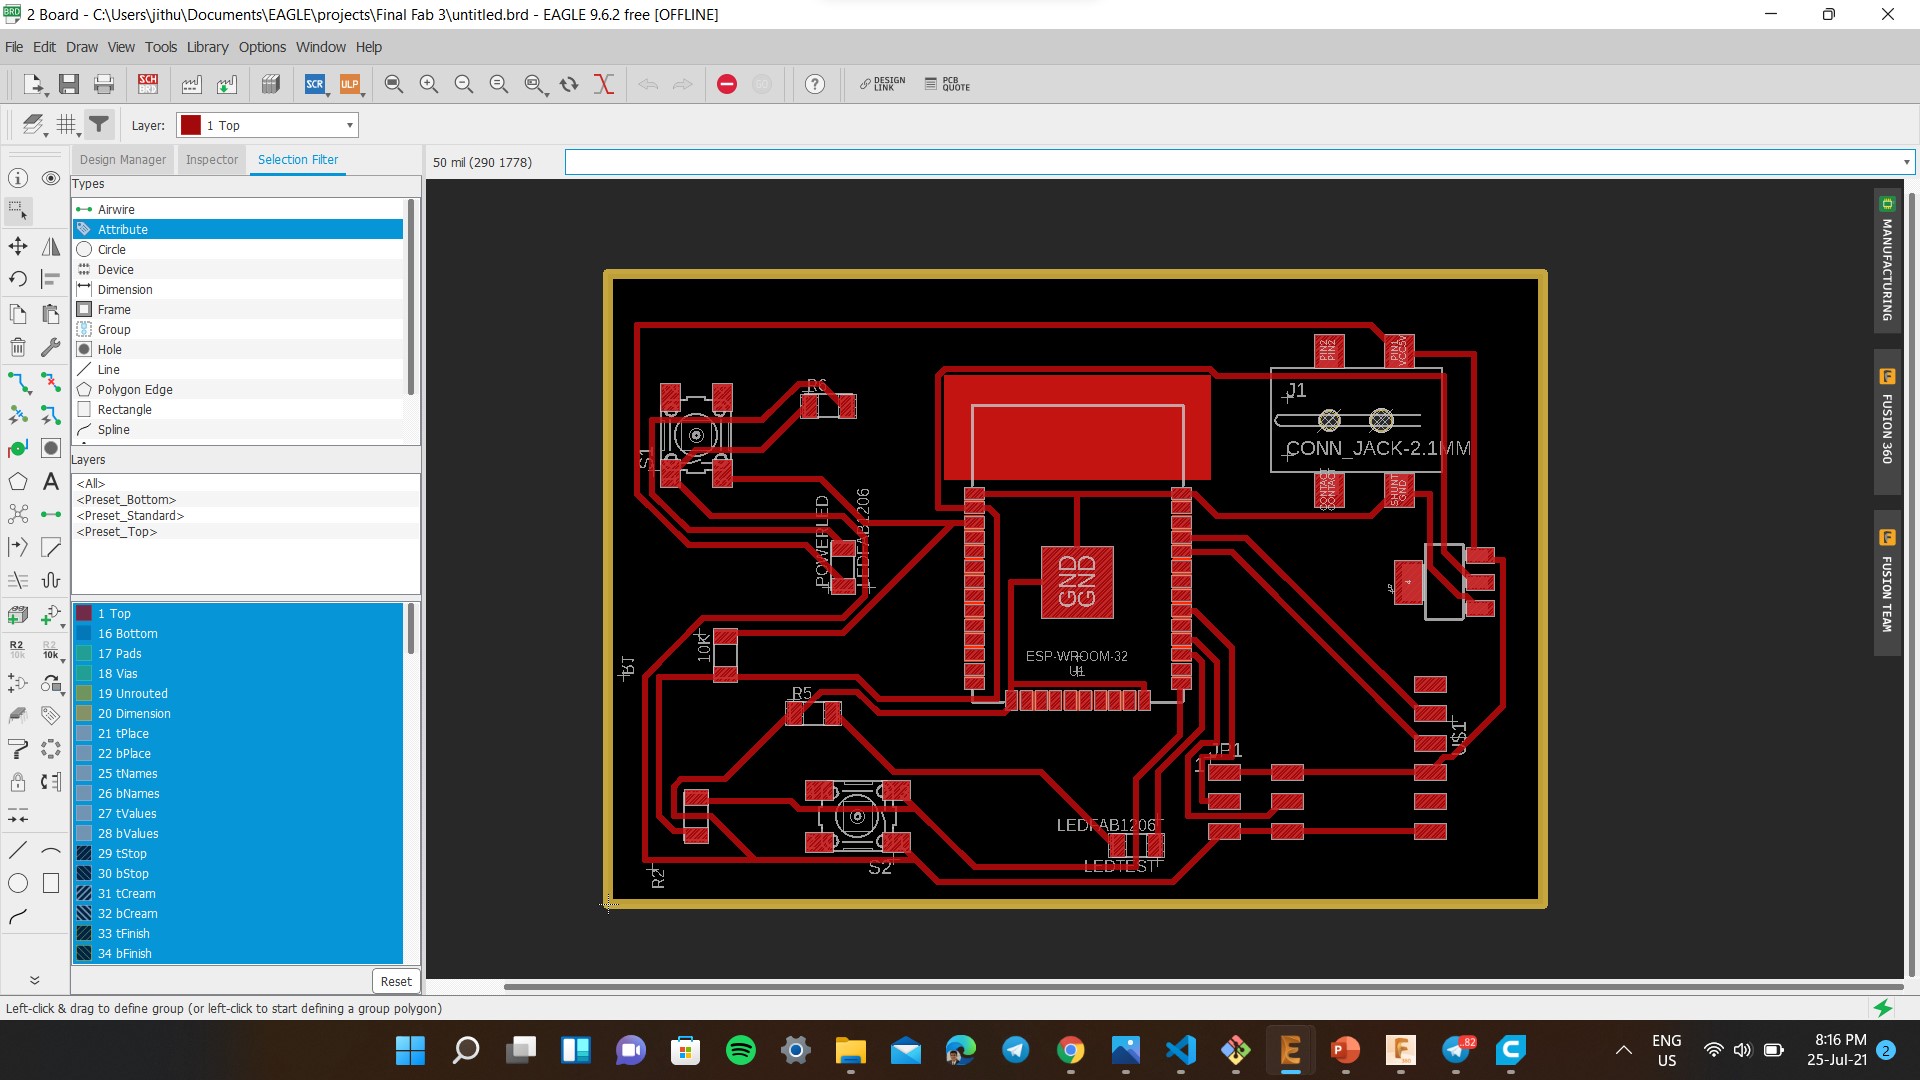
Electronic Designing
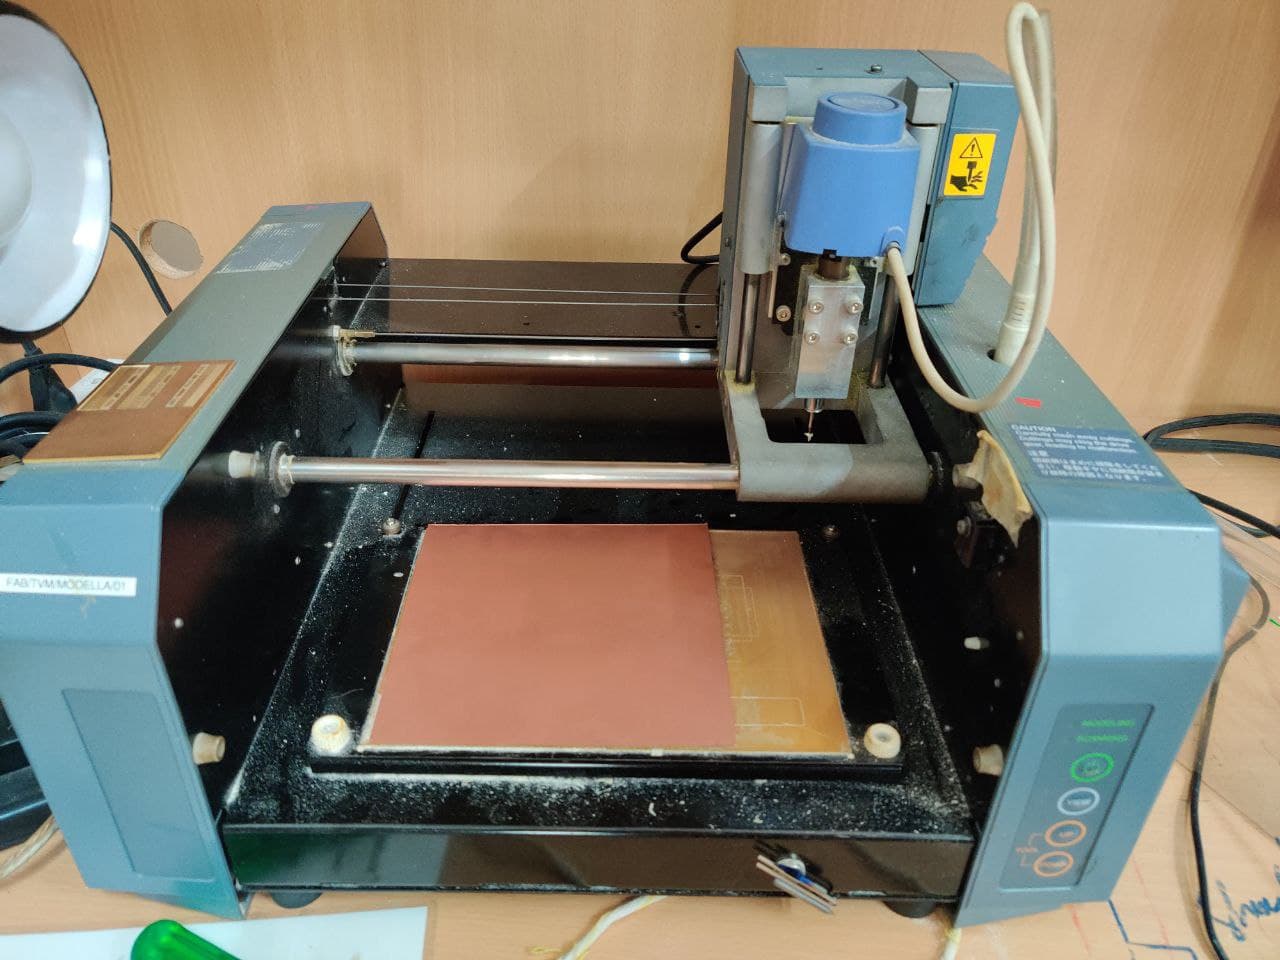
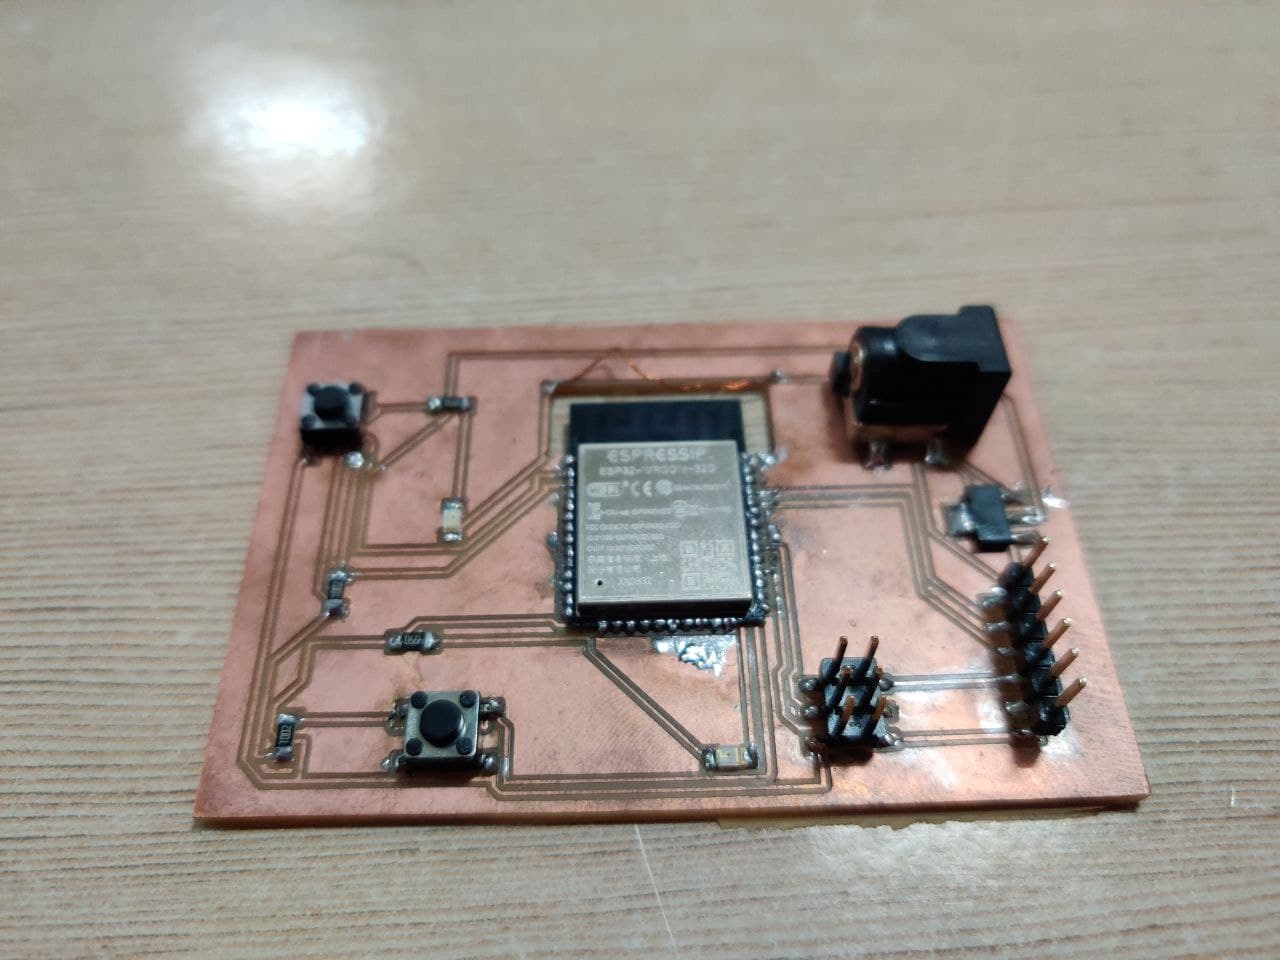
For this process, I had used Autodesk Eagle. I had specifically considered the dimension of the base so that the board would easily fit inside it. Once milled, the board was throughly cleaned with a blade and components were soldered. The ESP32 took a lot of effort to get it soldered due to the pin size. I required ESP32 as I needed Wi-Fi connectivity and EPS 32 WROOM 32 satisfied all my requirements. Moreover ESP32 have Dual-Core processor so that I can run program for fetching and second one for updating the map. Click here to know more about ESP32. I had used serial communication to individually address each LEDs and I will further explain about it later on. The below images show about the PCB Milling process and the soldered board.
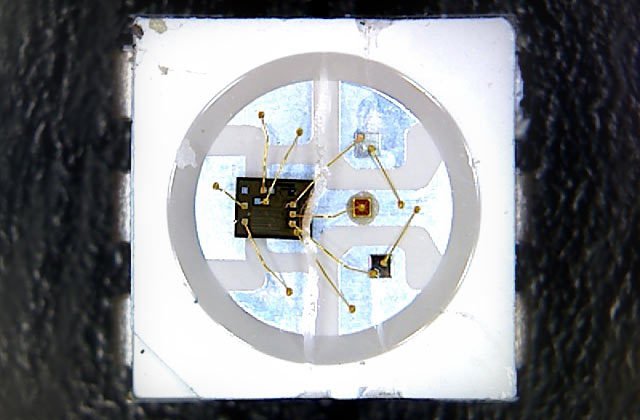
Adafruit 1655 LED (Neopixel) WS2812
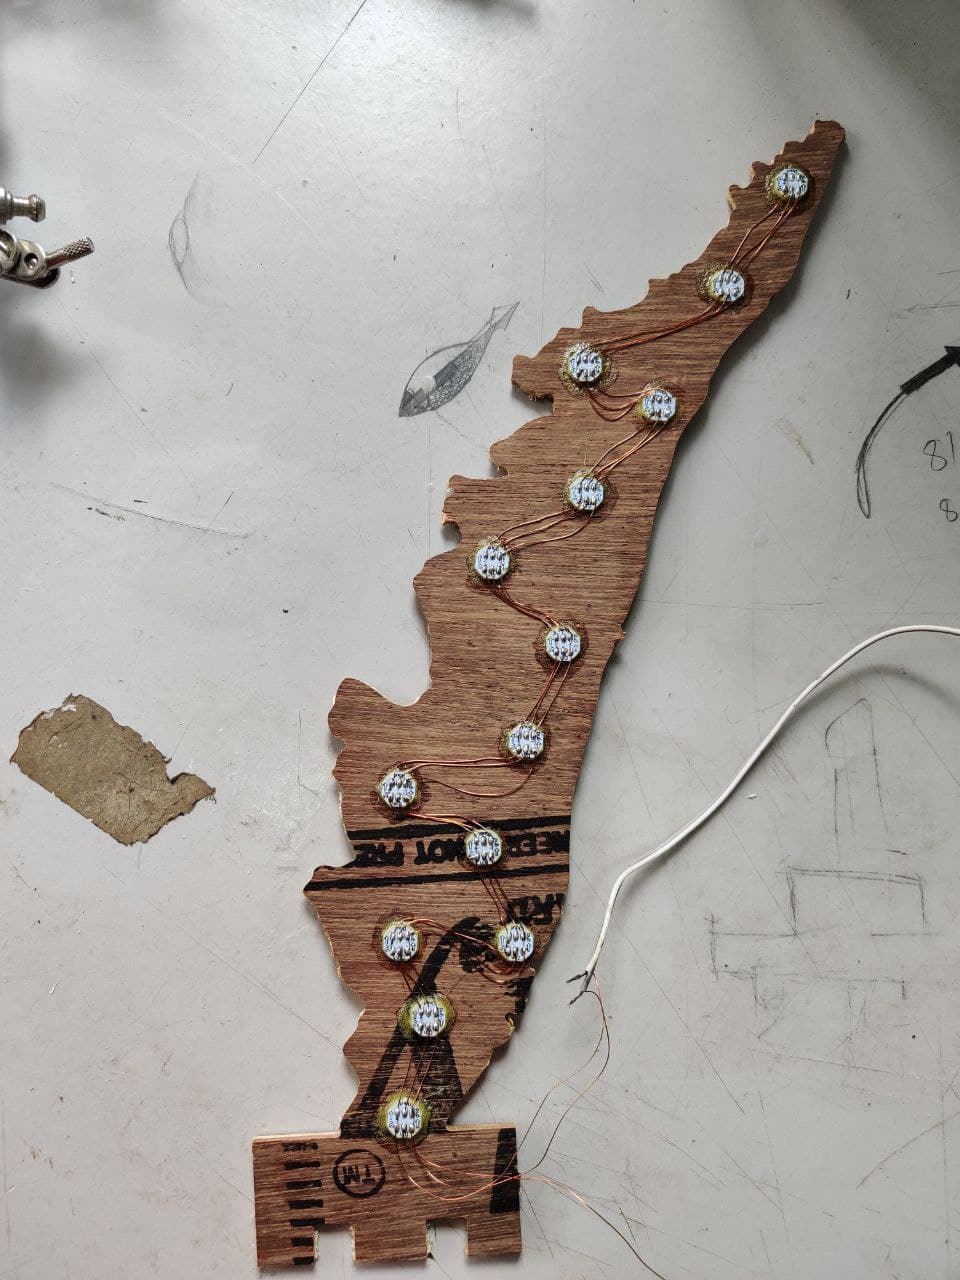
NeoPixel is Adafruit’s brand for individually-addressable RGB color pixels and strips based on the WS2812, WS2811 and SK6812 LED/drivers, using a single-wire control protocol. NeoPixels don’t just light up on their own; they require a microcontroller (such as Arduino) and some programming. Red, green and blue LEDs are integrated alongside a driver chip into a tiny surface-mount package controlled through a single wire. They can be used individually, chained into longer strings or assembled into still more interesting form-factors. I had individually wired the LEDs using an insulated copper wire and I will add the image about the same.
Sensing Module
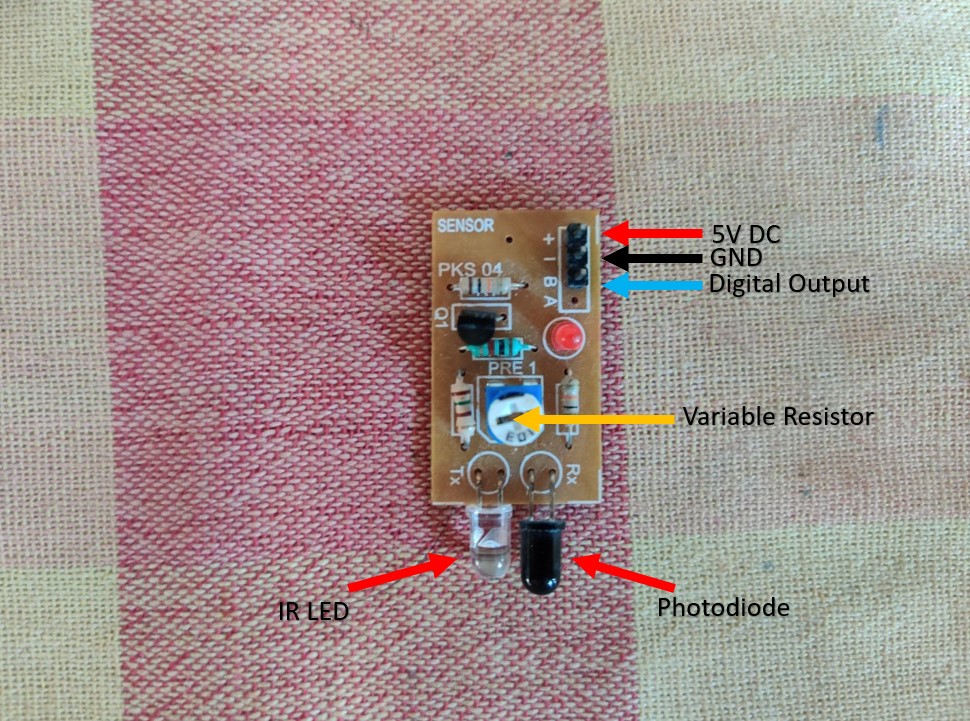
An infrared sensor is an electronic device, that emits in order to sense some aspects of the surroundings. An IR sensor can measure the heat of an object as well as detects the motion. These types of sensors measure only infrared radiation, rather than emitting it that is called a passive IR sensor. Usually, in the infrared spectrum, all the objects radiate some form of thermal radiation. These types of radiations are invisible to our eyes, which can be detected by an infrared sensor. The emitter is simply an IR LED (Light Emitting Diode) and the detector is simply an IR photodiode that is sensitive to IR light of the same wavelength as that emitted by the IR LED. When IR light falls on the photodiode, the resistances and the output voltages will change in proportion to the magnitude of the IR light received. Proximity Sensor are used to detect objects and obstacles in front of sensor. Sensor keeps transmitting infrared light and when any object comes near, it is detected by the sensor by monitoring the reflected light from the object. It can be used in robots for obstacle avoidance, for automatic doors, for parking aid devices or for security alarm systems, or contact less tachometer by measuring RPM of rotation objects like fan blades. The module features a 3 wire interface with Vcc, GND and an OUTPUT pin on its tail. It works fine with 3v3 to 5V levels. Upon hindrance/reflectance, the output pin gives out a digital signal (a low-level signal). The onboard preset helps to fine tune the range of operation, effective distance range is 2cm to 80cm. The properties of the module are as follows:
- Onboard detection indication.
- Effective distance range of 2cm to 80cm.
- A preset knob to fine-tune distance range.
- Detection angle: 35 °.
- Comparator chip: LM393.
The below image shows the IR Sensor Module that I am using for this week's assigment. I am using IR Sensor module based on transistor.
3D Printing
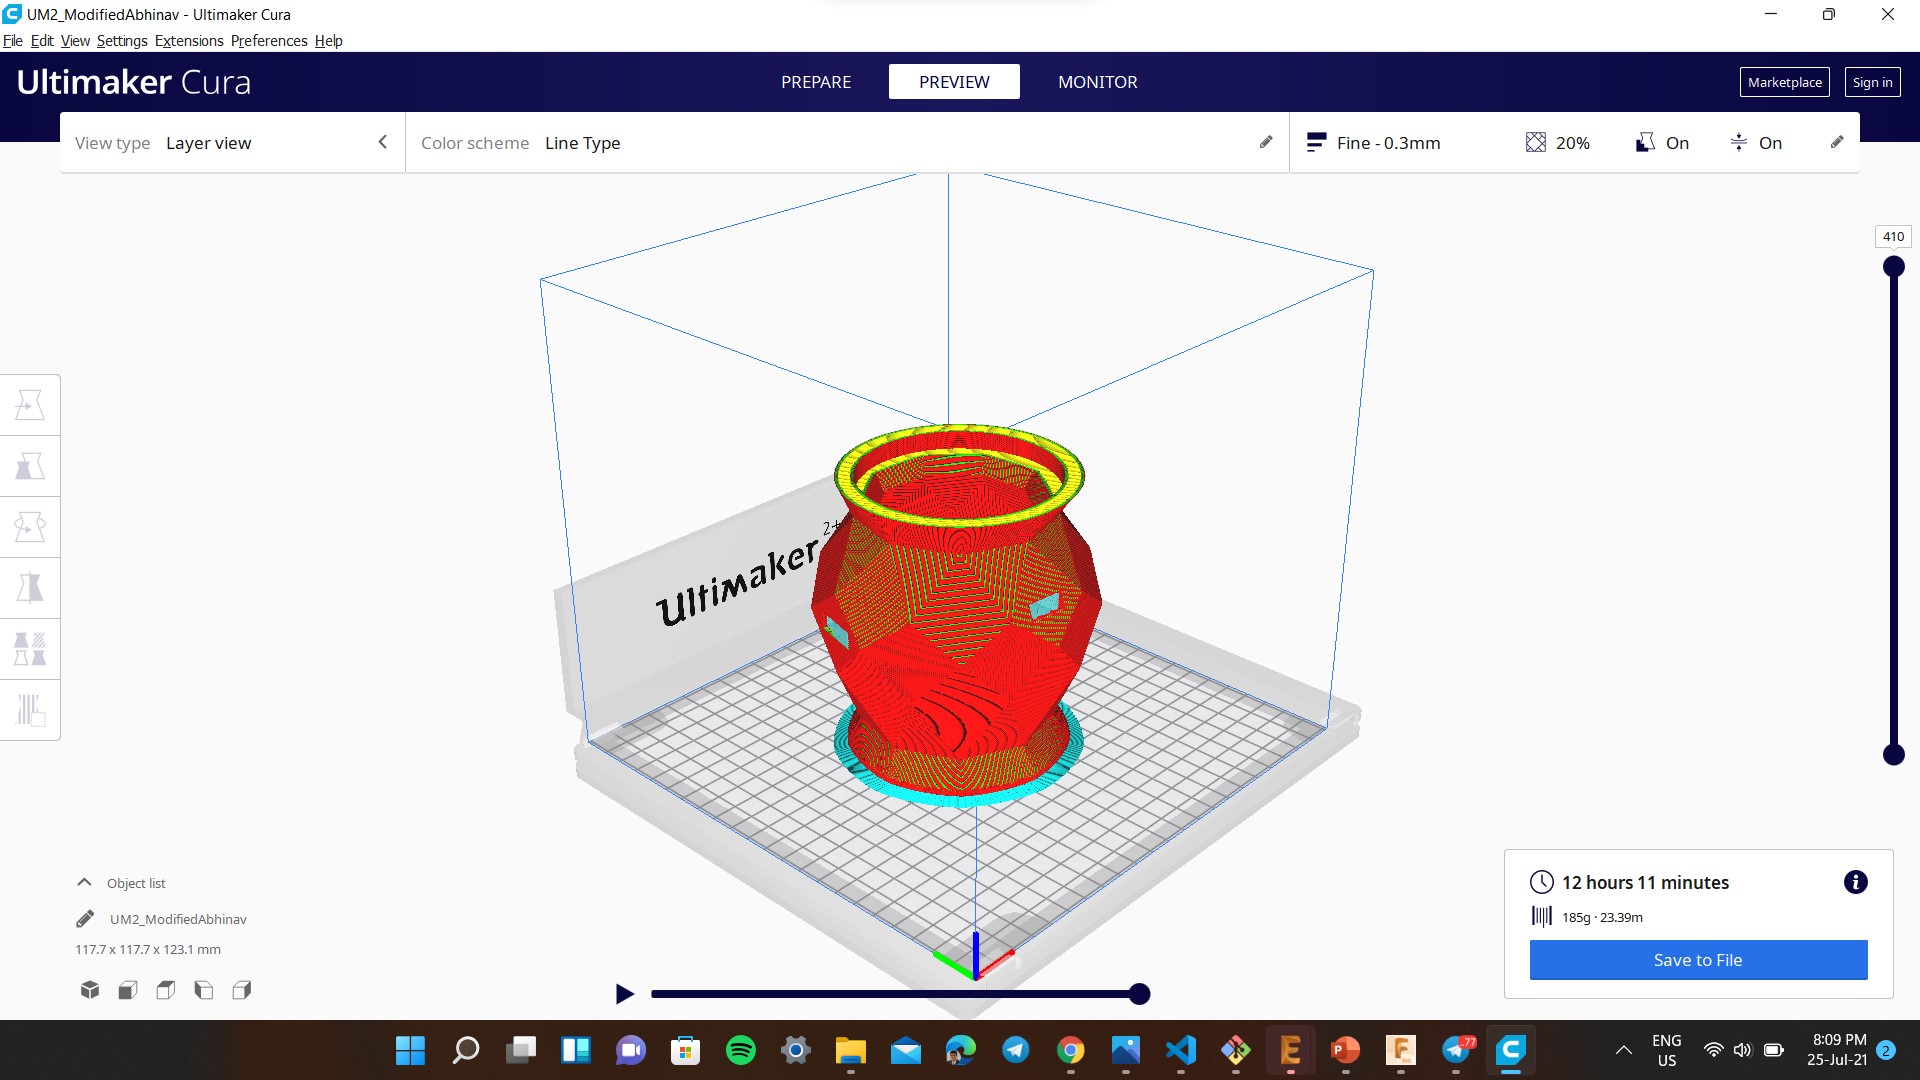
The STL file that I had exported from Fusion was sliced using Cura and was fed into Ultimaker 2+ 3D Printer. The print was successful and the geometric design was beautiful to see.
Laser Cutting
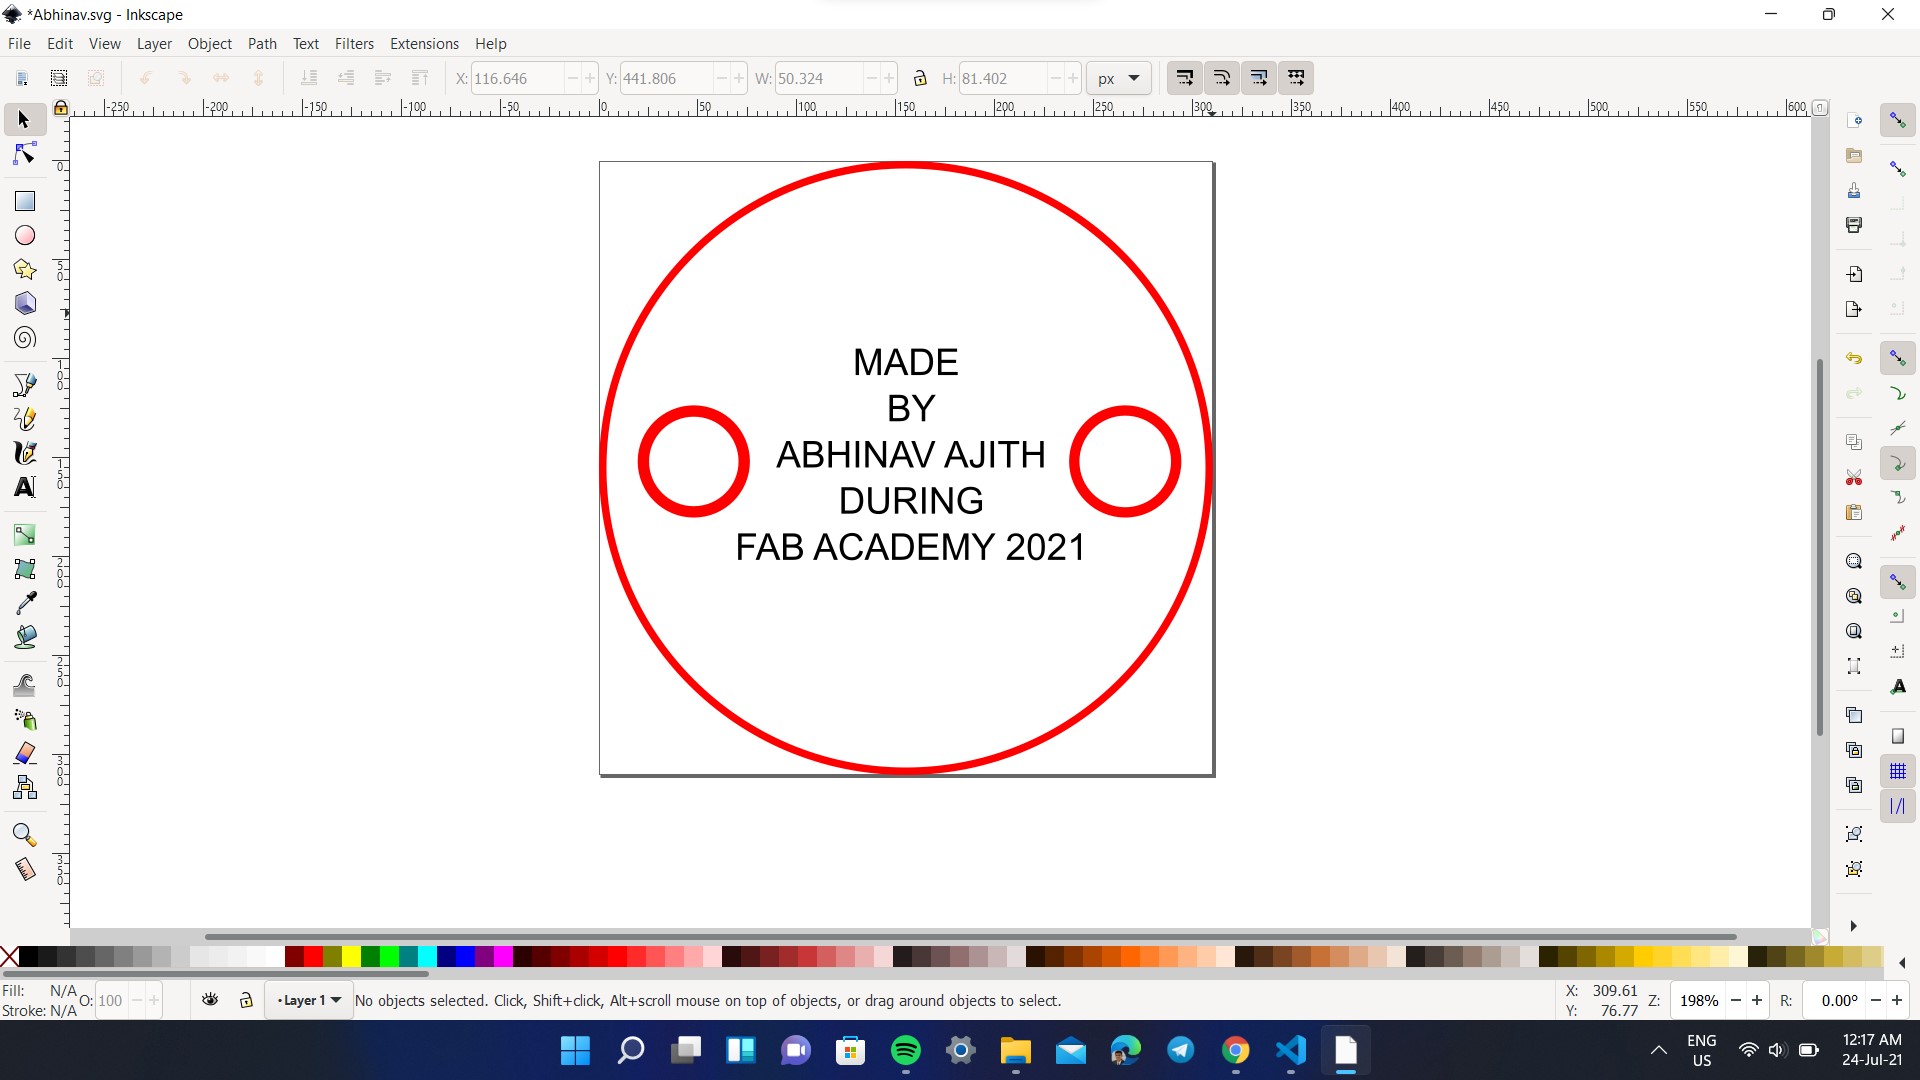
I had used laser cutting operation to make a base closure, for that I had used Inkscape to design and used Trotec Laser Engraving software to lasercut it.
CNC Routing
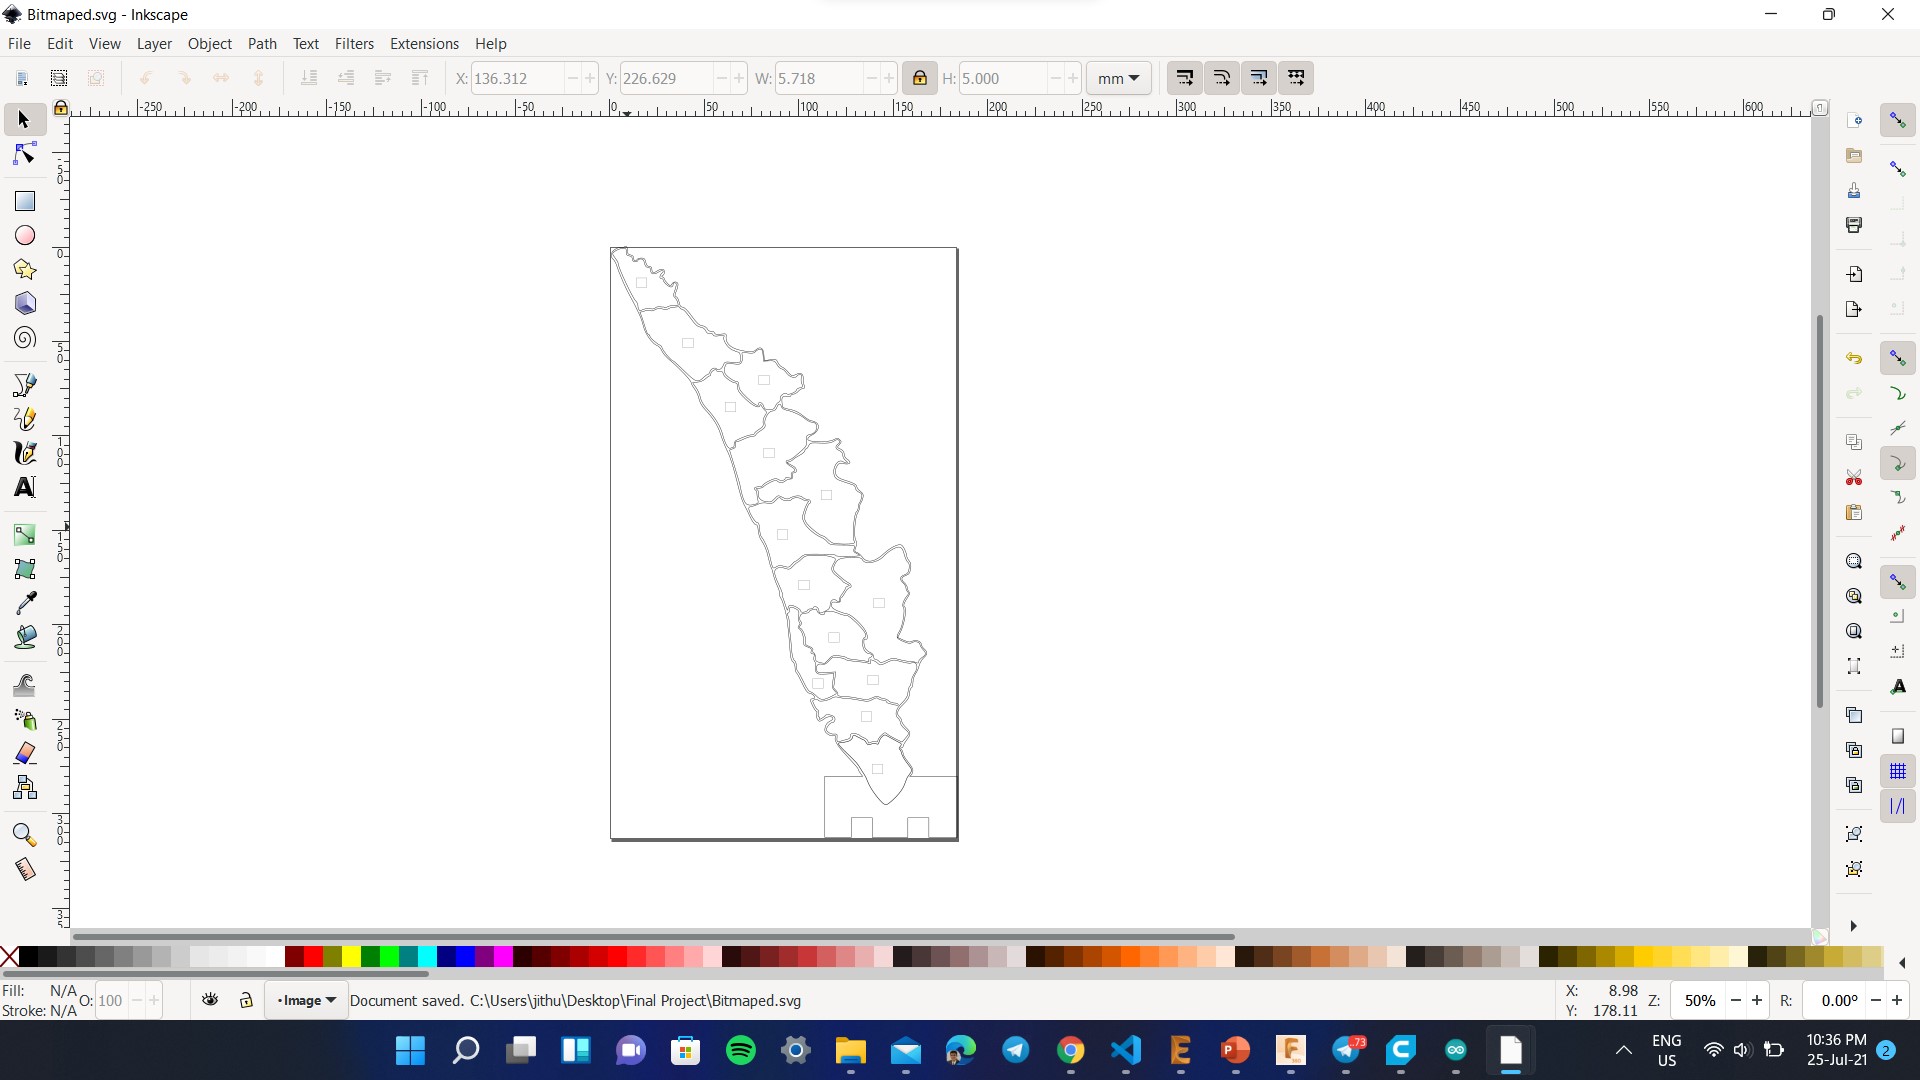
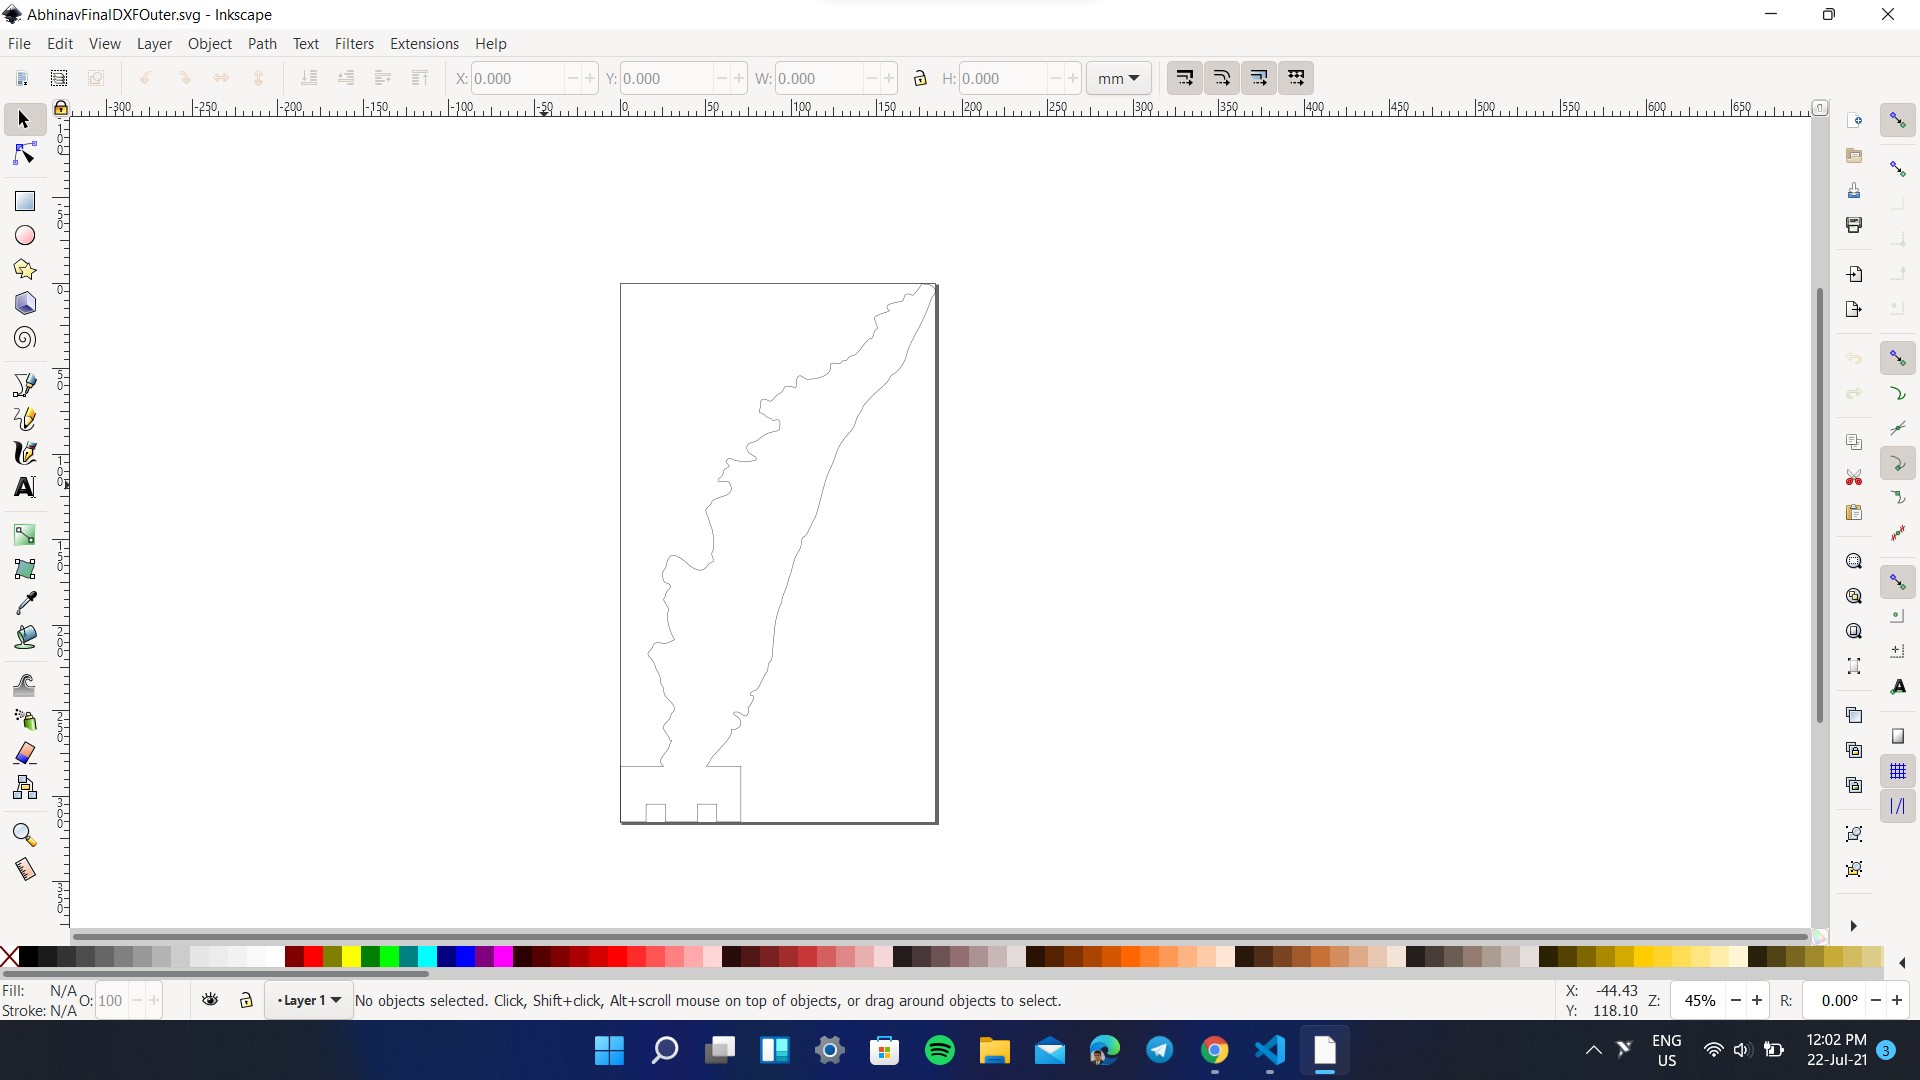
I had used this machining process to mill tha map for that I had designed the outline using Inkscape and then milled by exporting to VCarve Pro. The below shows the machining process and the outcome.
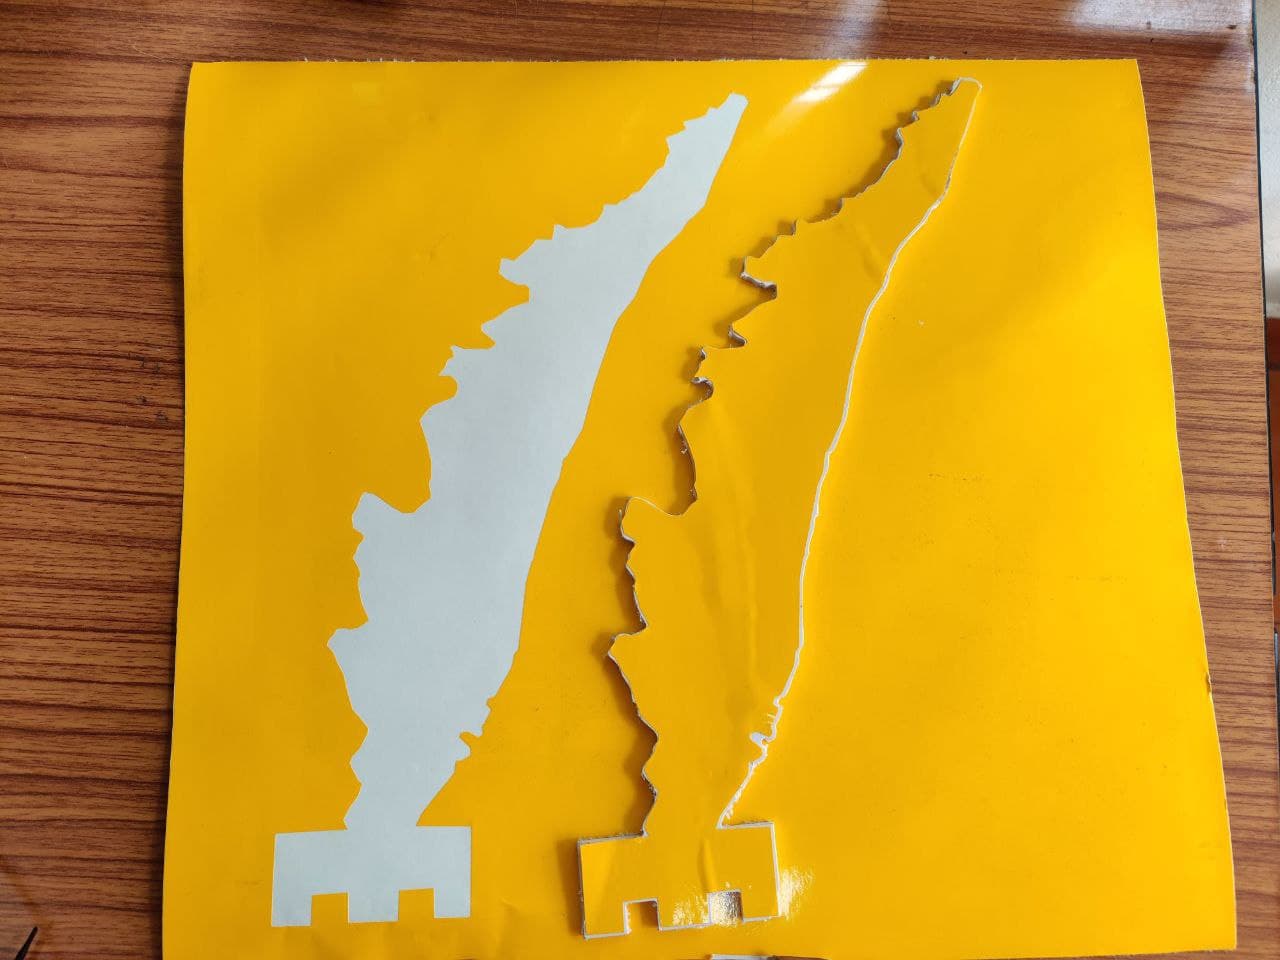
Vinyl Cutting
I had used Vinyl Cutting operation to create a sticker for the rear side of the map. For that I had used Inkscape, exported it to Fab Mods and fed to the vinyl cutting machine. The below images shows the same
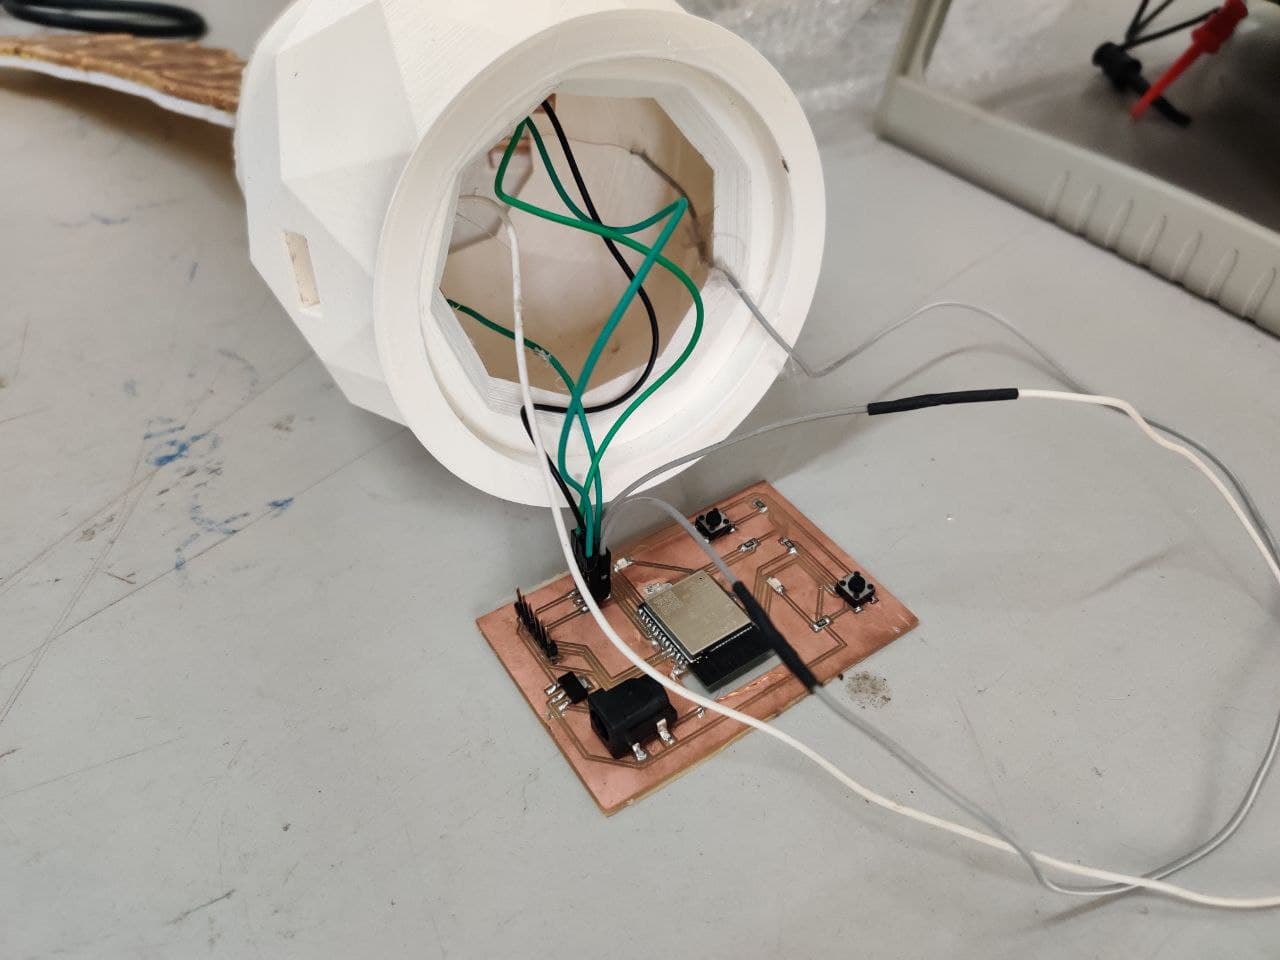
Assembly
After manufacturing all the components, the next step is to assemble all the parts. I had used press fit for base closure and the map. The wiring of the map was glued with an foam board outline of it. All the jumper wires were connected to the board and now it's ready to be programmed.
Programming
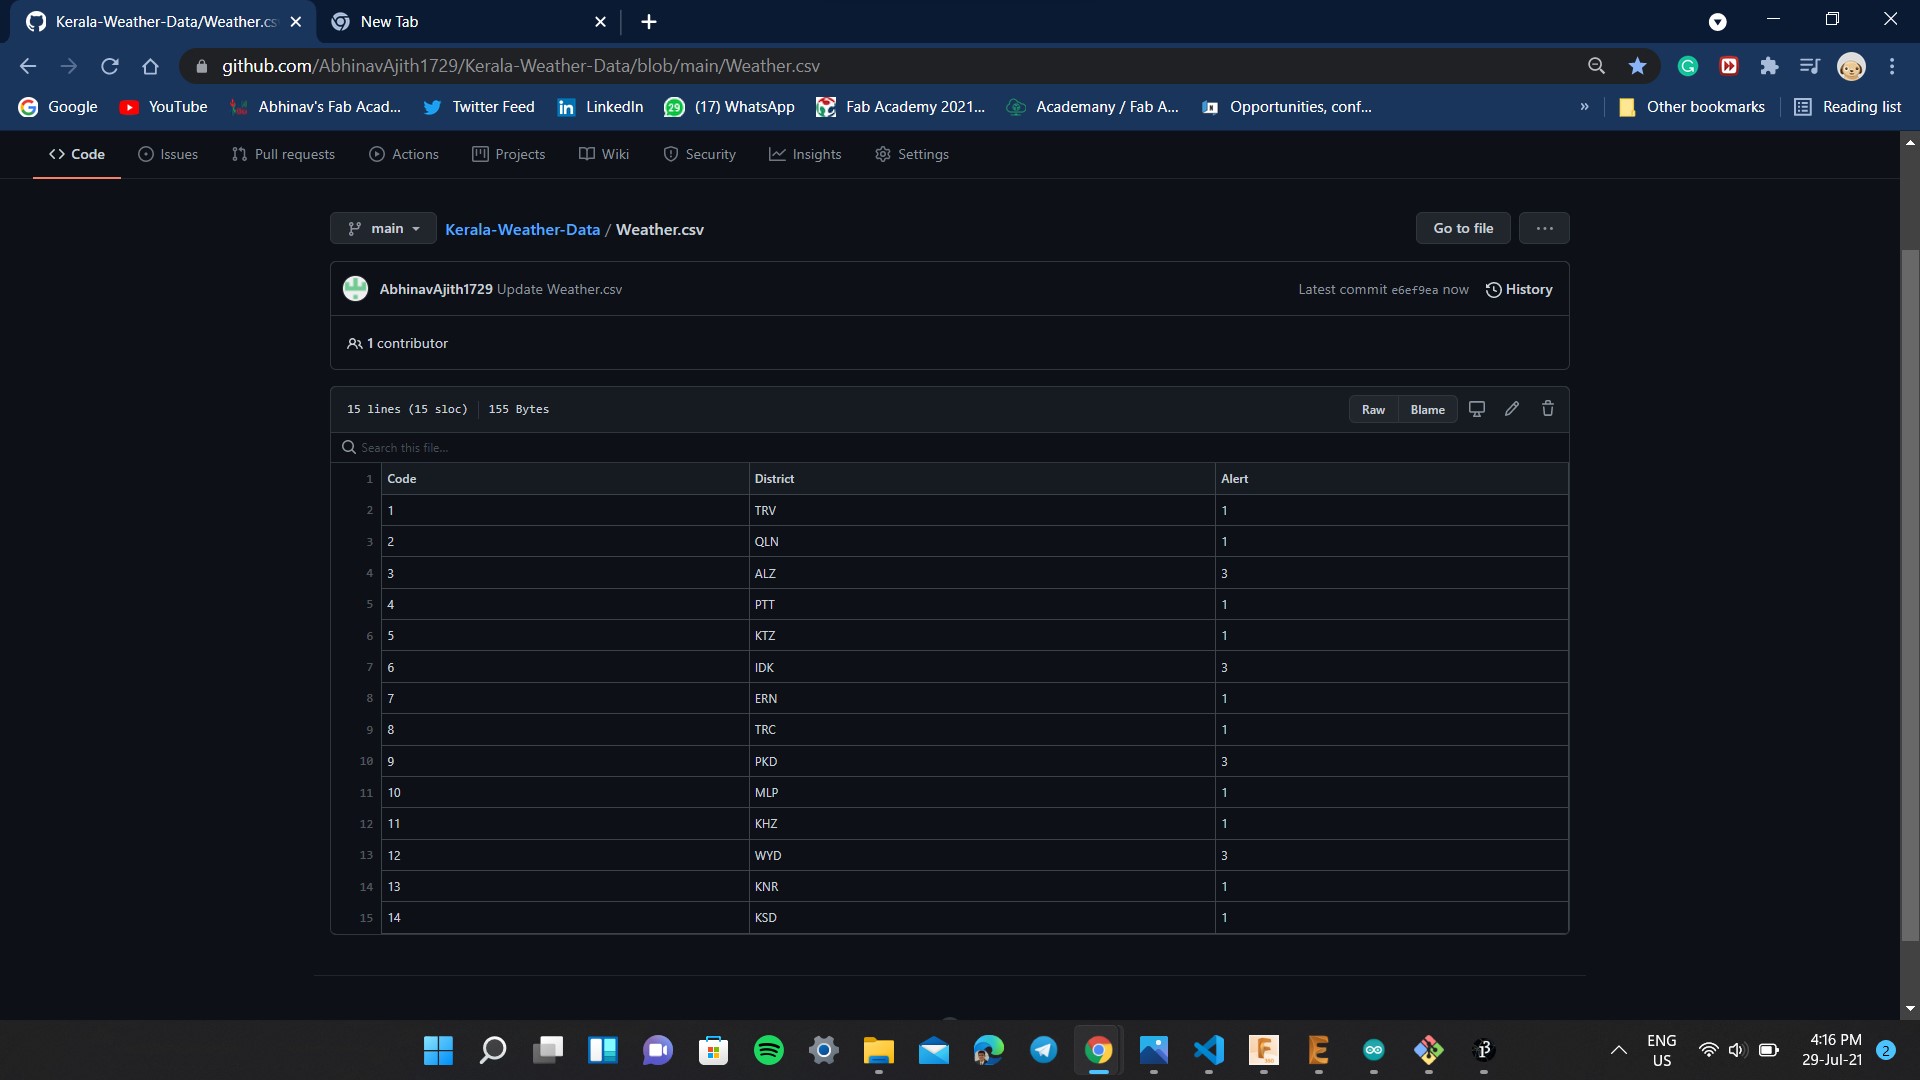
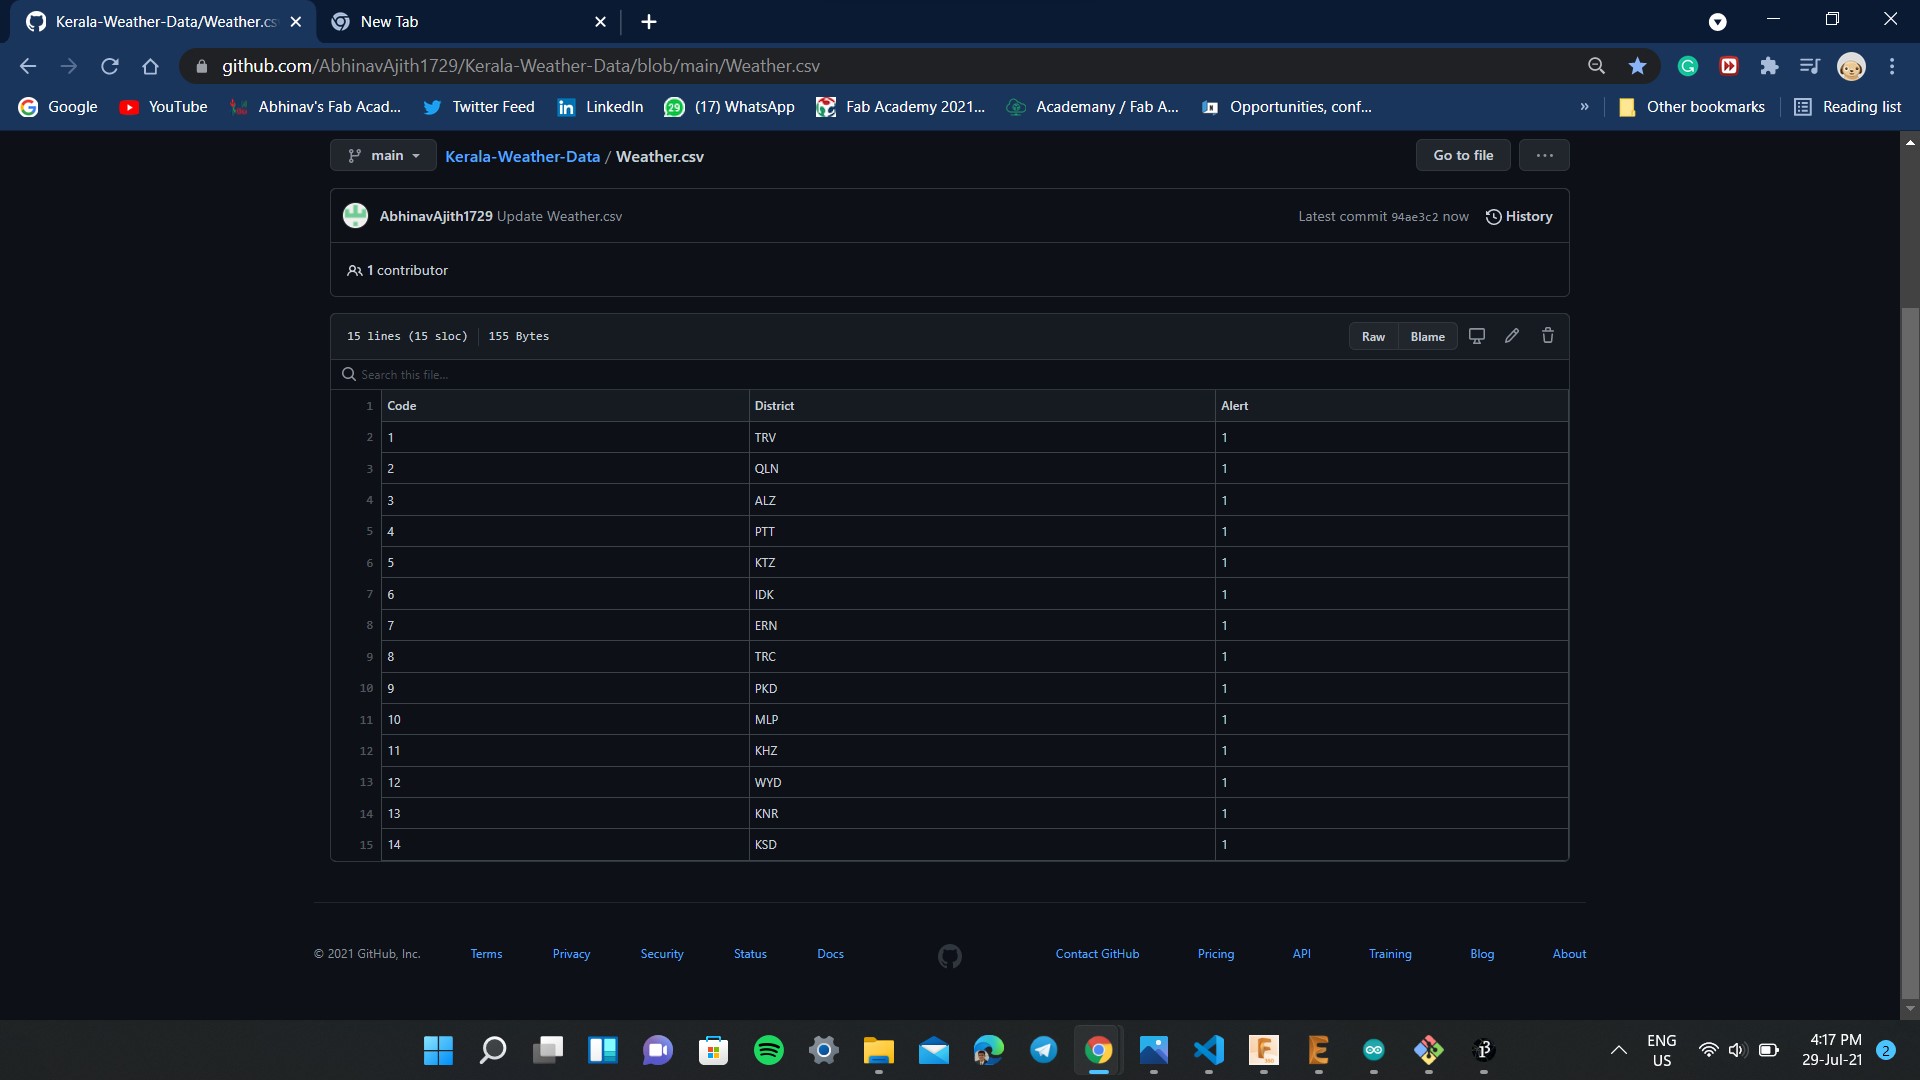
The programming is the most difficult part of the project as this involved both fetching the data from the Github as well as updating the map. I programmed in such a way that the map gets updated every 2 minutes (considering the updation time of Github) based on the data from the Github. The weather data is hosted in Github as a CSV file, once the file is fetched from the Github, the program automatically removed the header (1st row of the file), the remaining lines are divided into different tokens using strtok_r function. When the region code mentioned in CSV file matches with the code in the map, the color gets updated. The beauty of the system is that a single serial communication wire can individually control all the LEDs using NEOPIXEL library. The detailed program is given below.
		#include <.Adafruit_NeoPixel.h> //Remove the full stop
			#include <.WiFi.h>
		   #include <.WiFiClientSecure.h>
		   #define NUM_REGION 14 //Total number of LEDs
		   int pixelRegion[NUM_REGION] = {0,1,2,3,4,5,6,7,8,9,10,11,12,13}; //Giving Identity to the individual LEDs
		   #define SIGNAL_PIN  18 //The main serial communication pin in the board

		   const char* ssid     = "Abhinav"; //My Wifi Credentials
		   const char* password = "mypassword";
		   const char* csvHost  = "raw.githubusercontent.com"; //CSV Host is Github
		   const int csvPort    = 443;
		   const char* csvURL   = "/AbhinavAjith1729/Kerala-Weather-Data/main/Weather.csv"; //Github File Link

		   Adafruit_NeoPixel strip(NUM_REGION, SIGNAL_PIN, NEO_GRB + NEO_KHZ800);

		   #define RED_COL     1
		   #define ORANGE_COL  2
		   #define GREEN_COL   3

		   uint32_t red = strip.Color(255, 0, 0);
		   uint32_t orange = strip.Color(255, 60, 0);
		   uint32_t green = strip.Color(0, 255, 0);
		   uint32_t blue = strip.Color(0, 0, 255);
		   uint32_t white= strip.Color(255, 255, 255);
		   uint32_t pink = strip.Color(255, 105, 80);
		   uint32_t cyan = strip.Color(0, 255, 255);

		   #define UPDATE_INTERVAL 10
		   unsigned long lastUpdateTime = 0;

		   void setPixelColor(int region, int alert) {

			 // array starts at 0
			 region = region - 1;

			 if(alert == RED_COL) strip.setPixelColor(pixelRegion[region], red);
			 else if(alert == ORANGE_COL) strip.setPixelColor(pixelRegion[region], orange);
			 else if(alert == GREEN_COL) strip.setPixelColor(pixelRegion[region], green);
		   }


		   void updateMap() {

		   Serial.println();
		   Serial.println("------------ Updating Map ------------");

		   WiFiClientSecure httpsClient;
		   httpsClient.setInsecure();

			if(!httpsClient.connect(csvHost, csvPort)) {
			   Serial.println("Unable to connect to Github :(");
			   return;
			 }
			 Serial.println("Connected to Github");
			 httpsClient.print(String("GET ") + csvURL + " HTTP/1.1\r\n" +
			   "Host: " + csvHost + "\r\n" +
			   "Connection: close\r\n\r\n");

			   // download all the headers
			 while (httpsClient.connected()) {
			   String line = httpsClient.readStringUntil('\n');
			   if (line == "\r") break;
			 }

			// download first line (column headers)
			 String line = httpsClient.readStringUntil('\n');

		   // download all the lines
			 while(httpsClient.available()) {

				// get line and convert into char array (for strtok)
			   String line = httpsClient.readStringUntil('\n');
			   char buf[line.length()];
			   line.toCharArray(buf, sizeof(buf));

			   // divide the line into tokens (comma-separated)
			   char *p = buf;
			   char *str;
			   int tokenCount = 0;
			   int regionCode;
			   int regionNew;

			   // extract region code and number of new alert
			   while ((str = strtok_r(p, ",", &p)) != NULL) {
				 tokenCount++;
				 if(tokenCount == 1) regionCode = atoi(str);
				 else if(tokenCount == 3) regionNew = atoi(str);
			   }


		   setPixelColor(regionCode, regionNew);
			 }
			 strip.show();
			 Serial.println("Pixel colors updated");
		   }

		   void setup() {
			 pinMode(0,INPUT_PULLUP);
			 Serial.begin(115200);
			 Serial.println("Maruti: Kerala Weather Map");
			 Serial.println();

			 strip.begin();
			 strip.setBrightness(50);
			 strip.clear();
			 Serial.println("NeoPixel library init DONE");

			 WiFi.mode(WIFI_STA);
			 WiFi.begin(ssid, password);
			 Serial.println("WiFi init DONE");

			 while (WiFi.status() != WL_CONNECTED) {
			   delay(100);
			 }
			 Serial.print("Connected to ");
			 Serial.println(ssid);
			  updateMap();

		   }

		   void loop()
		   {

		   if(digitalRead(17)==HIGH) //No obstacle detected
		   {

			 if(millis() > lastUpdateTime + (UPDATE_INTERVAL * 1000)) {
			   updateMap();
			   lastUpdateTime = millis();
			 }

		   }

			if(digitalRead(17)==LOW) //Obstacle detected
			{
			for(int i = 0; i < 5; i++) strip.setPixelColor(i, green);
			 for(int i = 5; i < 12; i++) strip.setPixelColor(i, white);
			 for(int i = 12; i < NUM_REGION; i++) strip.setPixelColor(i, red);
			 strip.show();
			 delay(900);

			 strip.clear();
			 delay(500);


			}


		   }

		   }
Before running the program you need to add ESP32 Board Manager to arduino IDE. For that you need to first copy this link Open Arduino -> File -> Preferances and paste the above json link. Now go to Tools -> Board -> Board Manager search for ESP32 and install the ESP32 board manager. After that go to Tools -> Board and find ESP32 Dev Module.
Testing
The final part of the assigment is to test the program by flashing it to the board. Thee below video shows the testing of the map.
Updation of the Map
So initally the user provides weather alert data to different districts via Github in a CSV file. Once the new alert data is received from the autorities, the user can change the weather data for different districts and commit the changes. The new data will be reflected in the map within 2 minutes. The below image and video shows the operation.
Party Trick
To meet the project requirements, I had added an IR sensor to detect an obstacle, if it's detected the map changes its color to the color of Indian Flag. After few seconds it will return to its original state
The Maruti: The Smart Map, worked perfectly and I am so happy that I could complete the pending assigments, final project and documentation within half a month. I know I could have done better but the covid didn't give me a chance to do what I intended to do. This project will be a lifechanger to the common people of the state, since can save a lot of lives if implemented properly.
Evaluation
Did I make the must have features: Yes
I made a smart map that displays the real time province/district wise colored warnings for the common people to understand the severity of weather phenomenon expected in their state.
What are the features that I could not include?
I could have included a voice alert system but due to time constraints I couldn't do it.
Further Steps
I will make the power supply independent by using a battery source and would also try to make the project smaller.
Softwares Used
- Autodesk Fusion 360
- Vcarve
- Inkscape
- Autodesk Eagle
- Cura Slicer
- MODS
- Arduino
- Github
- Trotec Pro
Design Files